Although the chaos in the cryptocurrency market has died down, the consequences of the FTX implosion are still felt across the landscape, including Bitcoin (BTC). However, BTC is nearing the $17,000 mark, and indicators suggest there is hope for a bullish move in the first half of 2023.
Indeed, the money flow index (MFI) for Bitcoin is demonstrating a similar chart pattern compared to the asset’s previous two bottoms, with an expected ‘bullish turn’ in the period between one to five months, pseudonymous crypto and stock market analyst Trend Rider noted on December 27.
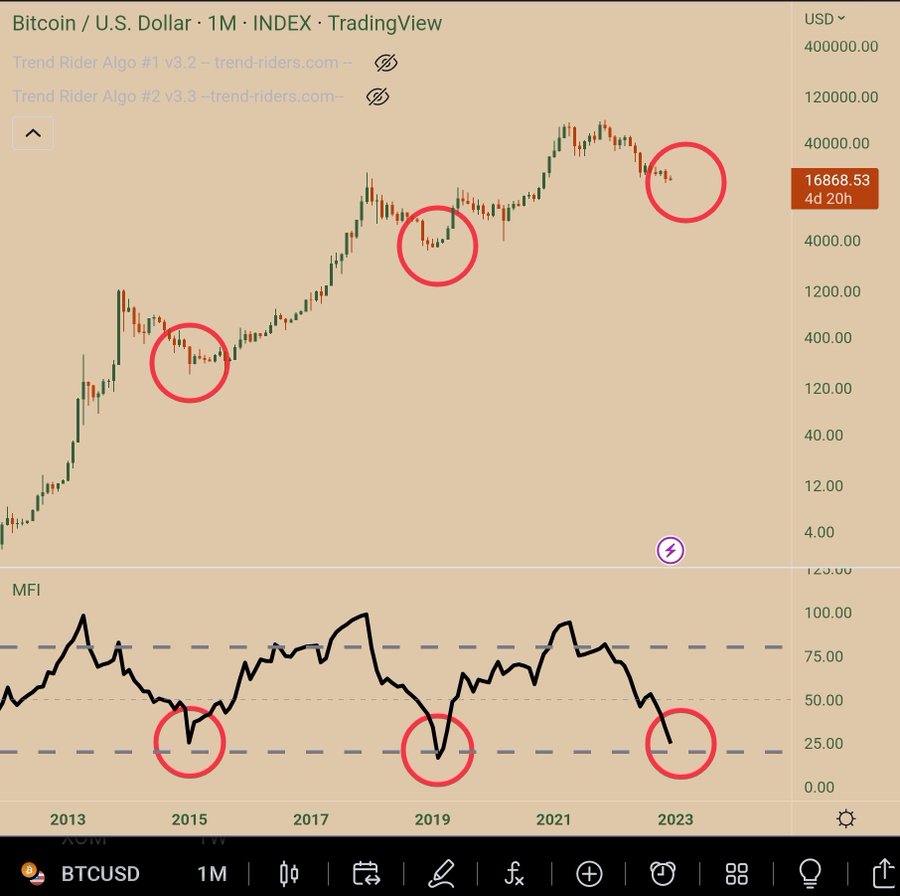
Is the bottom finally in?
Meanwhile, CryptoNoob has observed that the maiden decentralized finance (DeFi) asset was “trading in the oversold zone, which is historically where the bottom forms,” and which indicates an upward movement is likely in the future. At the same time, Trader Tardigrade stated that Bitcoin was in an ascending triangle trading pattern and that it was going to make a choice to either break out or break down from it.
Picks for you
That said, the renowned crypto trader and analyst Rekt Capital predicted on December 26 that the flagship digital asset could close the month below $17,150 and even drop lower as it failed to move past its immediate resistance at this level.
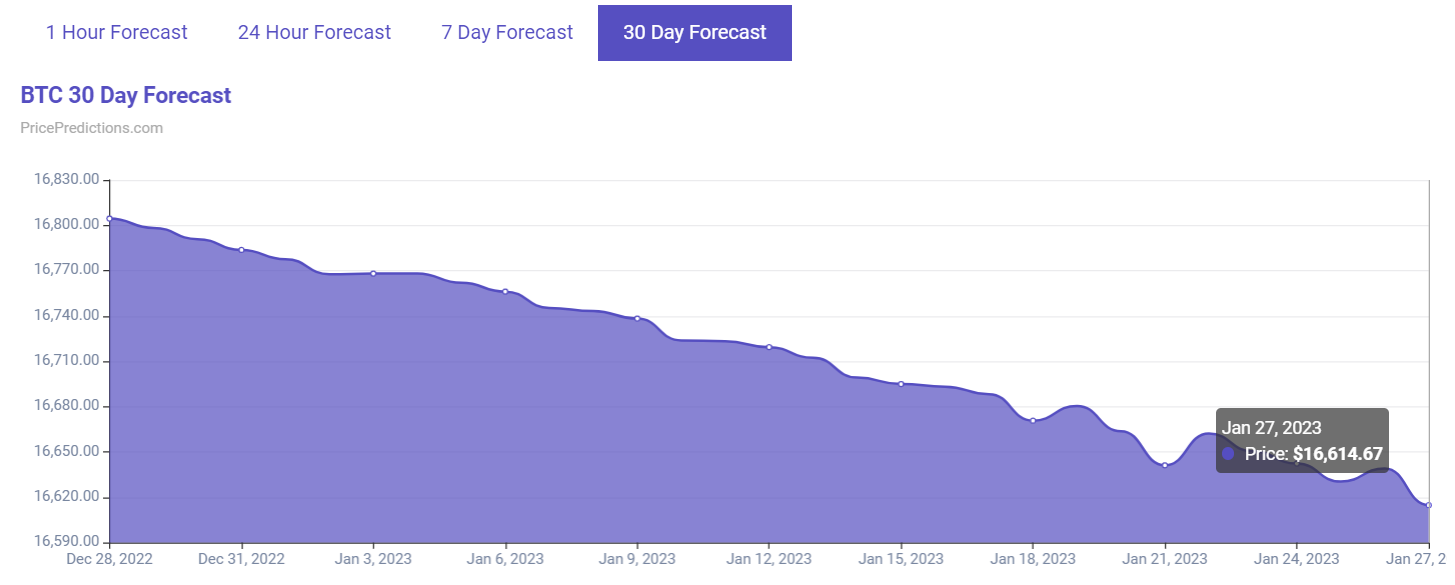
It is also worth noting that the machine learning algorithms are bearish, with PricePredictions’ forecast standing at $16,614.67 for January 27, 2023, and CoinPriceForecast indicating $16,919 for the end of December and $17,292 for the middle of 2023.
Bitcoin price still undecided
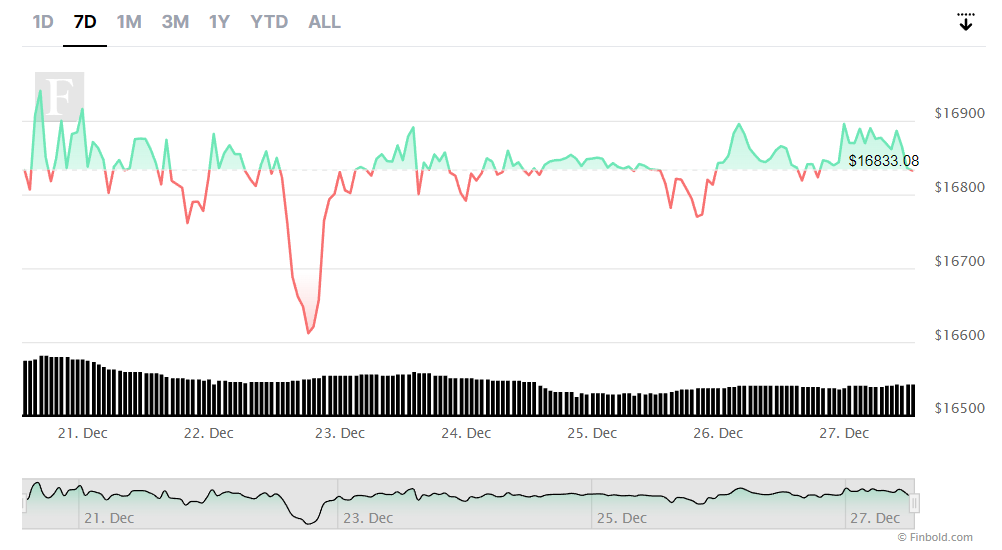
As things stand, Bitcoin is currently changing hands at the price of $16,832.87, demonstrating a decline of 0.2% on the day, as opposed to a 0.02% gain across the week and an increase of 1.55% over the previous 30 days, as charts indicate.
Considering Bitcoin’s sideways trading pattern and a lack of any significant triggers for a move in either direction, the digital asset could indeed require patience from investors waiting for a rally, which might not be in the cards for the near future.
Disclaimer: The content on this site should not be considered investment advice. Investing is speculative. When investing, your capital is at risk.