
Despite its price toning down after a bullish rally of the cryptocurrency market in January, the sentiment around Bitcoin (BTC) remains optimistic, as its chart patterns are giving off a buy signal, and several pointers suggest that the maiden digital asset has left the bear market.
Indeed, at the moment, Bitcoin is struggling with the 50MA (moving average), and its monthly chart is “giving us a buy signal with multiple indicators,” according to pseudonymous cryptocurrency analyst Seth who published his analysis on February 9.
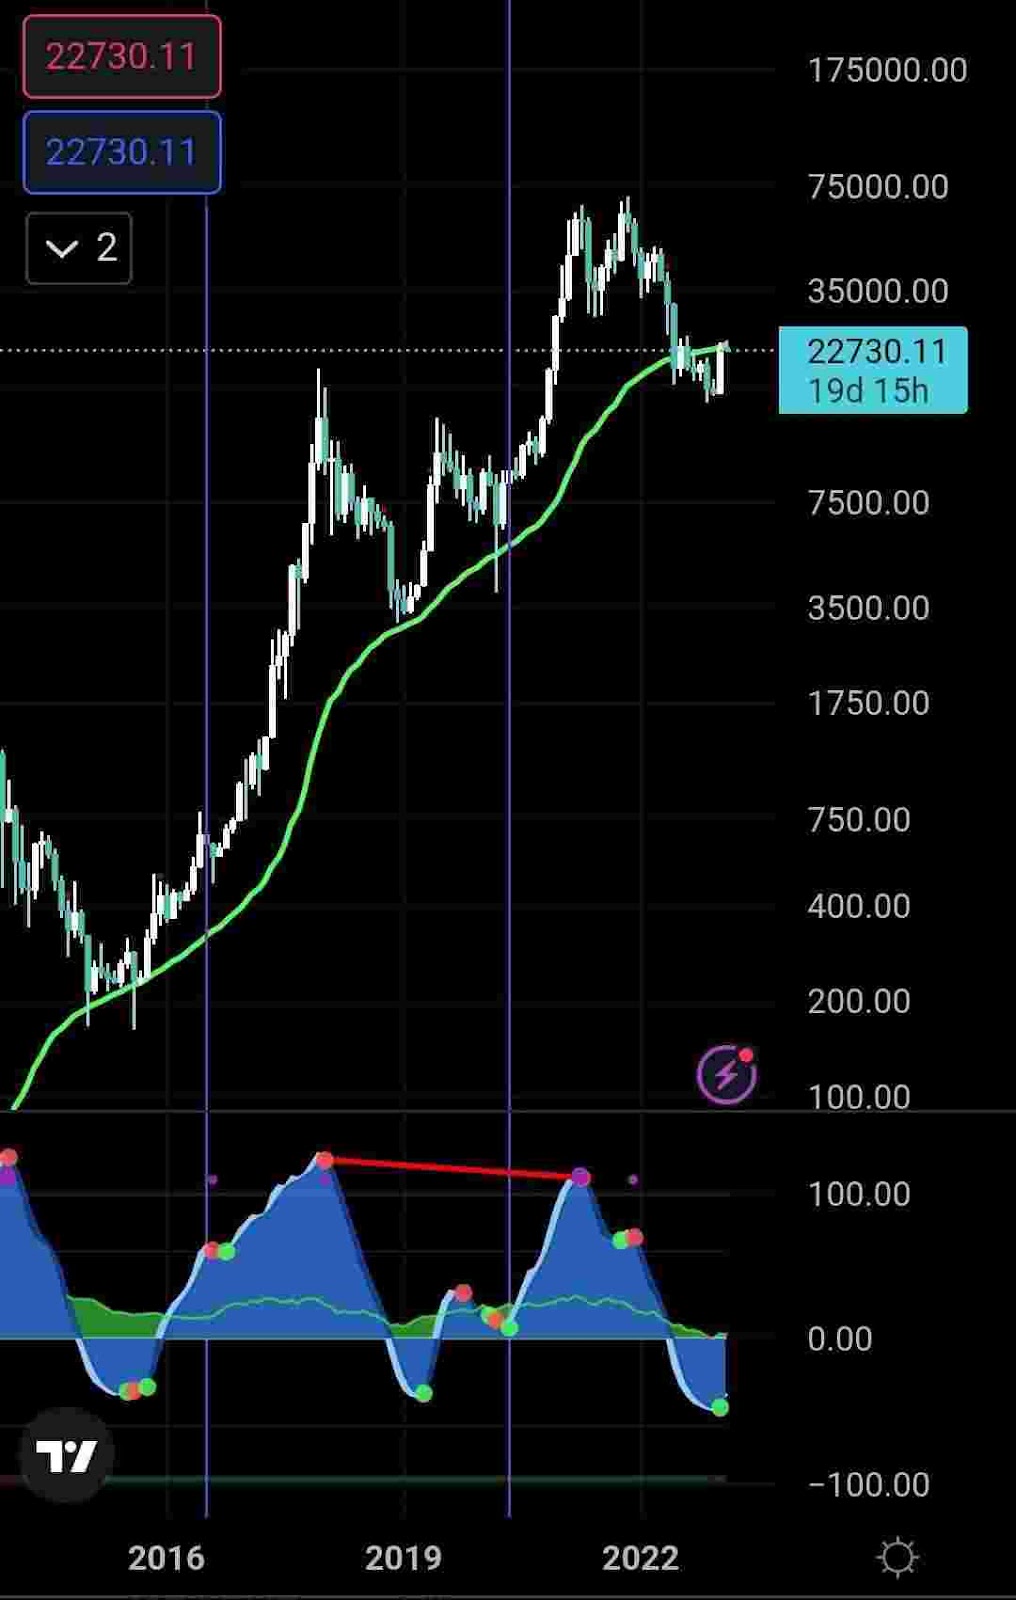
At the same time, the analyst drew attention to one of his earlier tweets in which he had suggested buying Bitcoin when its price stood at around $16,000, highlighting that the crypto traders who bought the flagship decentralized finance (DeFi) token at the time are now up by 42.5%.
Picks for you
Other positive signs
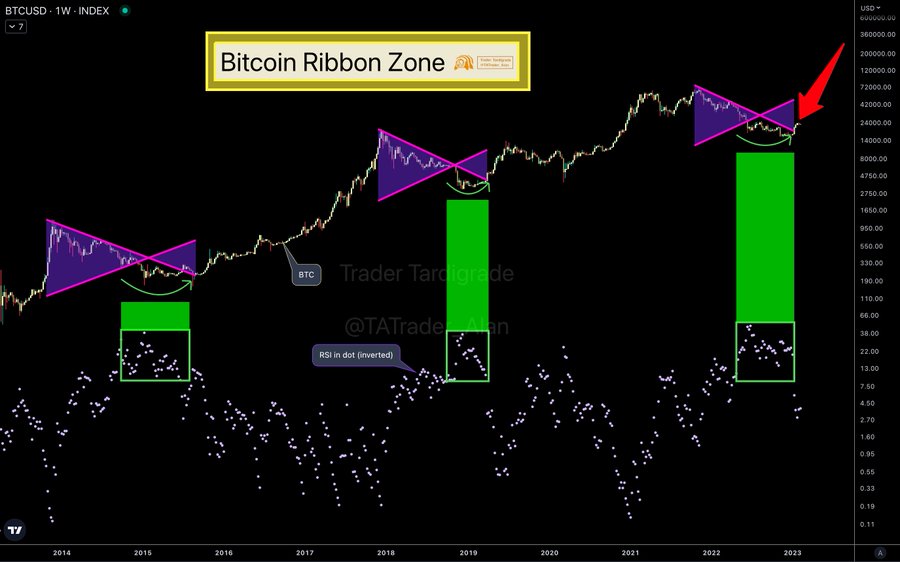
Another crypto expert, known as Trader Tardigrade, has also noted positive signs around Bitcoin, particularly in terms of its ‘ribbon zone,’ which represents a bear market. As the expert noted, “correlated with [relative strength index (RSI)], BTC has left the bear market.”
As it happens, the ribbon hash indicator refers to the periods of Bitcoin miners being in distress and possibly capitulating, with the assumption that these periods can happen when the BTC price is at major lows, and may accordingly present a good opportunity to buy the dip.
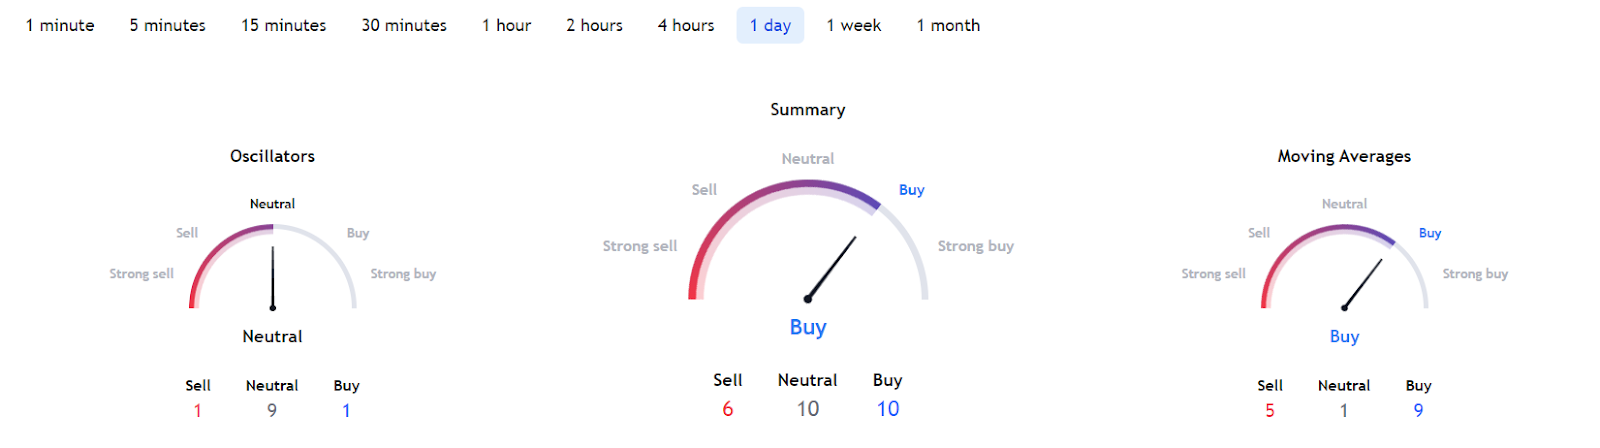
It should also be noted that BTC’s technical analysis (TA) indicators over at the finance tracking platform TradingView on their 1-day gauges also suggest buying at 10, as summarized from moving averages indicating ‘buy’ at 9, and oscillators in the ‘neutral’ zone at 9.
Elsewhere, Bitcoin’s network activity has surged to two-year highs, its highest level since May 2021, as the number of daily transactions on its blockchain reached 345,000, driven by the soaring popularity of Ordinals, the non-fungible tokens (NFTs) stored on the Bitcoin blockchain.
Bitcoin price analysis
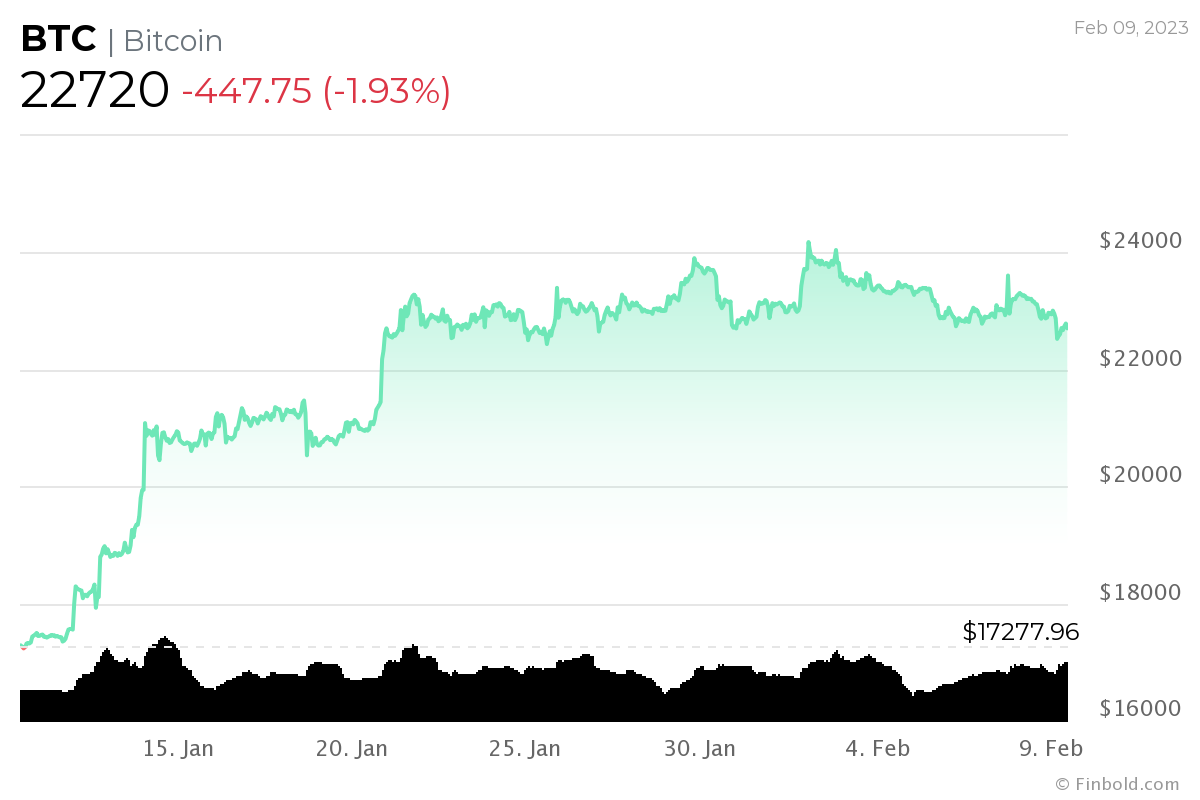
At press time, Bitcoin was changing hands at the price of $22,720, down 1.93% on the day, as well as declining 4.24% across the previous week but still recording increases on its monthly chart, gaining 32.13% over the past 30 days.
According to the renowned crypto expert Michaël van de Poppe, Bitcoin has its “support level and took liquidity, as volume has increased,” and if Bitcoin rises above $22,800, it can be stated that correction is indeed over.” Otherwise, he said he was “still mostly interested around $21,700.”
Disclaimer: The content on this site should not be considered investment advice. Investing is speculative. When investing, your capital is at risk.