
Hedera (HBAR) has been on a winning streak for a week now, driven largely by enterprise adoption and partnerships that helped position it as the 14th largest cryptocurrency on July 13.
At press time, HBAR was trading at $0.239, up almost 40% over the past seven days, and it enjoys a market cap of approximately $10.2 billion, as per CoinMarketCap.
According to Finbold’s AI price prediction model, HBAR could hit $0.250 by July 31 (a 4.44% increase from the current price).
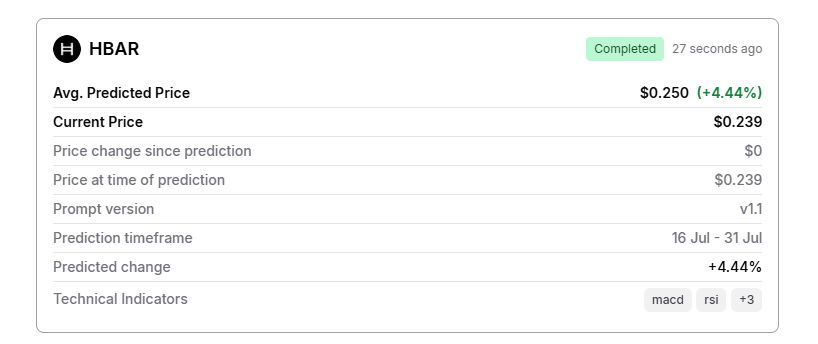
The prediction model relied on a multi-indicator framework, taking into account the Moving Average Convergence Divergence (MACD), Relative Strength Index (RSI), Stochastic Oscillator, MACD Slope, and 50-day Simple Moving Average (SMA).
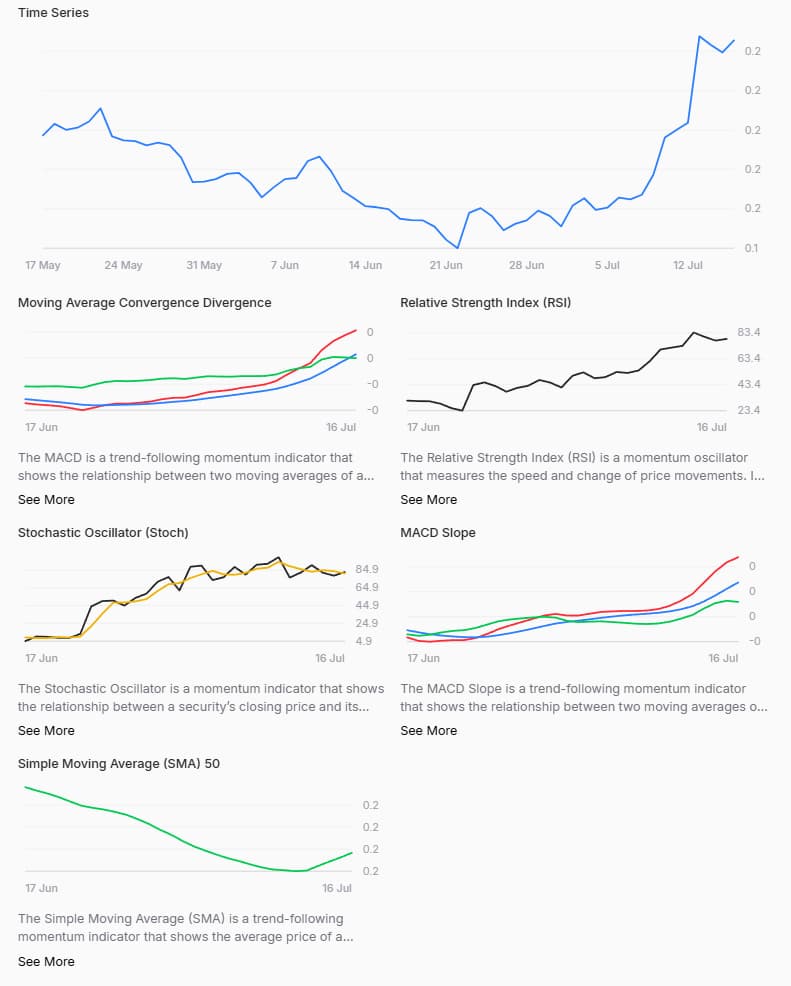
As we can see from the charts, even though HBAR has been on a general upward trend, the picture is more nuanced once the technical indicators are taken into account.
The MACD histogram is at +0.0092, and both the MACD and signal line slopes are still rising. However, the MACD histogram slope has started to flatten, pointing to a potential deceleration in upward momentum.
Further, the 7-day Relative Strength Index is approaching the 83.4 mark, which is well above the overbought threshold.

Similarly, the Stochastic Oscillator is in the 80–82 range, which suggests a potential price correction or consolidation. A bearish crossover is likewise already forming.
Finally, HBAR’s 50-day SMA appears to be going upward after a longer period of decline. This suggests a bullish bias, given that the current price is well above the SMA average of 0.167.
HBAR trading volume
Meanwhile, Hedera’s 24-hour trading volume has slipped 15% to $749 million based on CoinMarketCap data, although derivatives open interest remains high at $450 million, indicating continued speculative interest.
Together with the technical indicators discussed above, this suggests the AI’s projected price of $0.250 is a cautiously optimistic and modest upside.
That is, HBAR’s recent rally and performance relative to its peers do point to a continued growth potential, but mixed technical signals imply a trend reversal is also possible.
Featured image via Shutterstock