Artificial intelligence model ChatGPT has projected a potential timeline and price range for when XRP could reach its market bottom.
The outlook comes as XRP continues to face increased volatility following a sudden drop in early February, triggered by broader market sentiment.
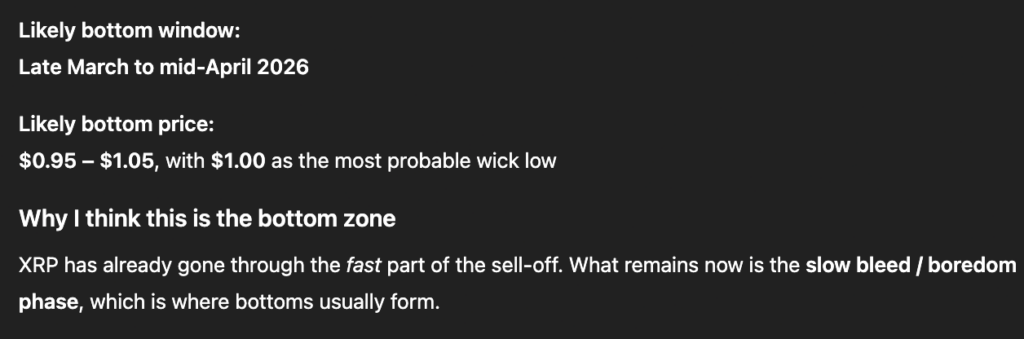
According to ChatGPT’s assessment, XRP could bottom within the next two months, most likely between $0.95 and $1.05, with $1.00 as the probable final downside test.
This view is based on market structure, investor behavior, and broader cryptocurrency dynamics rather than external forecasts.
It suggested the sharp sell-off has largely played out, with XRP now in a low-volatility exhaustion phase that has historically aligned with major market bottoms as selling pressure fades and long-term holders return.
The $1 level is identified as a key psychological support and prior consolidation zone, where price often gravitates before reversing.
The model also noted that valuation compression is largely complete, with XRP now priced defensively rather than for aggressive growth, a condition typical near market lows.
When will XRP bottom
Recent weakness is attributed mainly to broader crypto market trends, leading to the view that XRP should stop making new lows once Bitcoin (BTC) stabilizes. In this setup, time is more important than price, with extended sideways trading likely needed to absorb remaining selling pressure.
Under its base case, which carries the highest probability, ChatGPT sees XRP bottoming near $1 between late March and April, followed by a prolonged consolidation.
Alternative scenarios include a bearish dip toward $0.80–$0.85 if a macro shock occurs, or a bullish outcome in which XRP holds above $1.10 without making new lows.
At the same time, the AI model noted that, XRP is projected to trade sideways between $1 and $1.30 for several months before a gradual recovery toward $1.60–$1.80, assuming supportive market conditions.
XRP price analysis
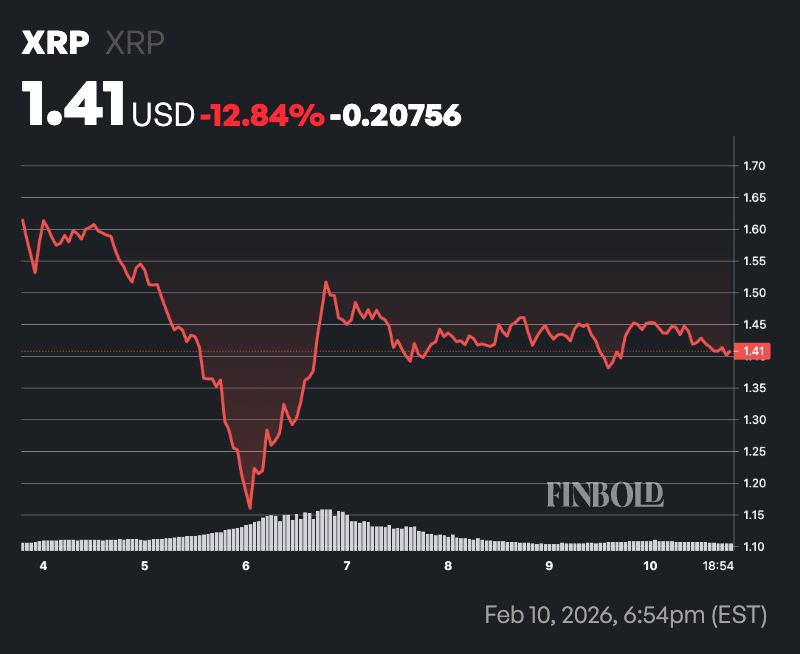
By press time, XRP was trading at $1.41, down about 1.6% over the past 24 hours. On the weekly timeframe, the token is down more than 12%.
XRP is trading well below both its key moving averages, keeping the broader technical picture tilted to the downside. The 50-day simple moving average sits near $1.89, while the 200-day SMA is higher at around $2.40.
This wide gap shows XRP remains firmly below its short- and long-term trend lines, signaling sustained bearish momentum and limited evidence of a trend reversal so far.
Meanwhile, the 14-day RSI is around 37.8, below the neutral 50 level but not yet in oversold territory. This suggests weakness persists, though the RSI is approaching levels where downside momentum typically begins to slow.
Featured image via Shutterstock