After reaching a peak of nearly $130 per share in June, AMD’s (NASDAQ: AMD) stock price trajectory has taken a downturn over the last two months.
With a decline of approximately 15% during this period, the chipmaker’s stock has been facing a challenging phase, prompting investors to practice caution.
However, there may be reason for optimism once again for AMD investors. Notably, the stock is displaying a “huge bull flag on the weekly candle chart,” as highlighted by stock market analyst Jake Wujastyk on August 24.
What does this pattern indicate?
A bull flag pattern is a technical chart pattern that indicates a temporary consolidation phase within an uptrend. It consists of a sharp price rise (the “flagpole”) followed by a parallel channel where prices trade sideways or slightly downward (the “flag”).
Picks for you

This bullish chart pattern suggests a brief pause before the prevailing uptrend resumes, potentially leading to a breakout higher.
On the other hand, it can also signal exhaustion or a potential reversal if the breakout fails and prices breach the lower channel.
To interpret the bull flag pattern more accurately, traders should consider other factors such as volume trends and market context to make a distinction between a continuation and a potential trend reversal.
AMD stock price analysis
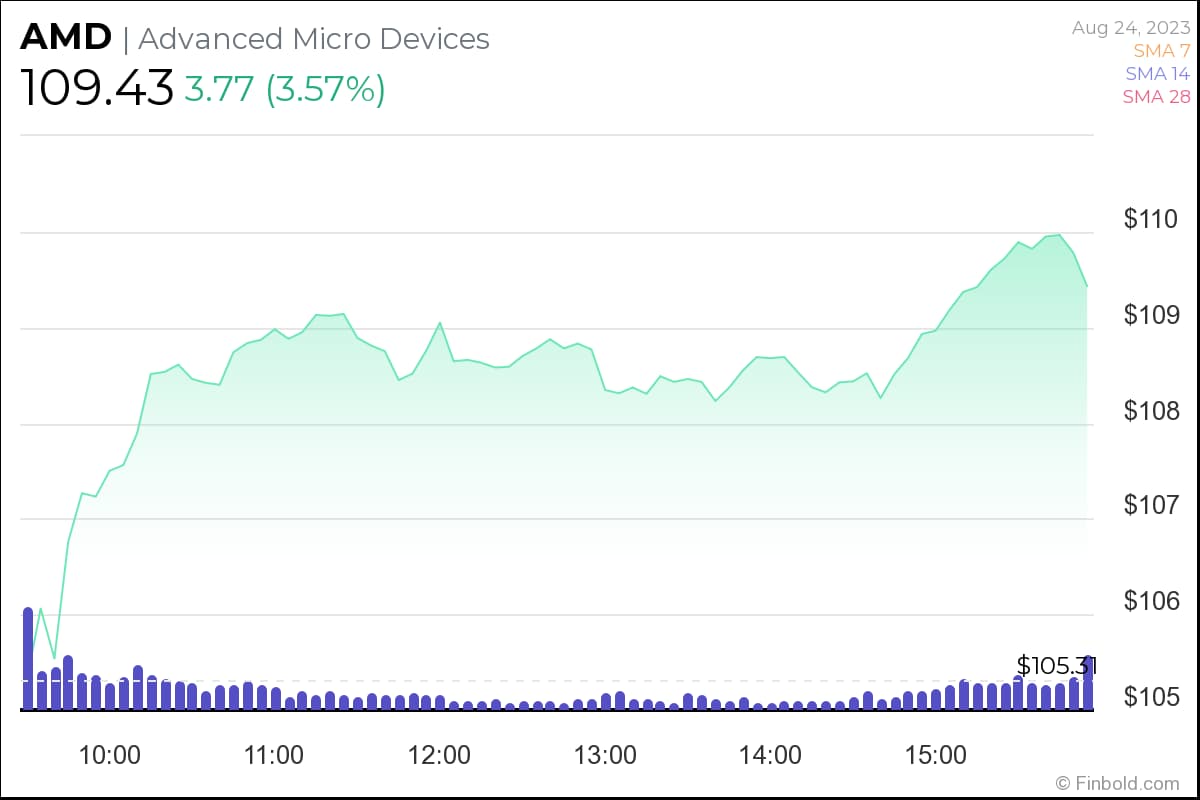
At the time of publication, shares of AMD were standing at $109.43, up more than 3.5% over the past 24 hours.
On the weekly chart, AMD’s stock fell by around 0.6% and over 1% on the month.
Year-to-date, the company’s gains remain strong at more than 65%, compared to the S&P 500’s ascent of 16%.
Wall Street’s predictions for AMD
Despite AMD’s recent challenges in terms of its stock market performance, analysts on Wall Street remain bullish on the chip manufacturer’s prospects.
Namely, the analyst consensus at TipRanks rates AMD as a ‘strong buy’ based on 32 analysts’ views over the past three months.
As a result, the strategists set an average 12-month price target of $141 for the stock, implying a potential upside of almost 30% from the current market price.
Buy stocks now with Interactive Brokers – the most advanced investment platform
Disclaimer: The content on this site should not be considered investment advice. Investing is speculative. When investing, your capital is at risk.