
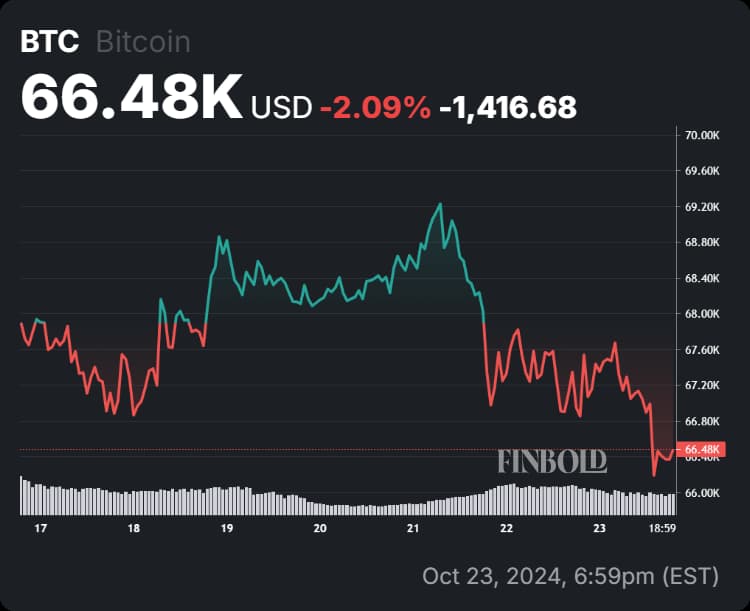
Bitcoin (BTC) has surged 7% over the last two weeks, rallying from $59,400 to $69,300. This sharp recovery has reignited market optimism, with an analyst identifying several key factors suggesting a potential bullish breakout for Bitcoin.
With the U.S. Presidential election just two weeks away, traders and analysts are closely watching how key events, such as the election and historical price cycles, might trigger Bitcoin’s next significant move.
Notably, an analysis by TradingShot leverages the Mayer Multiple Band, with Bitcoin hinting at a possible bullish breakout that aligns closely with its established four-year cycle pattern.
Historical 4-year cycles: A blueprint for the next rally
According to TradingShot, Bitcoin’s price has demonstrated a consistent four-year cycle, where it tends to undergo significant bull runs after periods of accumulation and consolidation.
As of late October 2024, Bitcoin’s price is trading between the Mean Mayer Multiple (MM) line and the 1st standard deviation (SD) above it, a pattern that has appeared at similar points in previous four-year cycles.
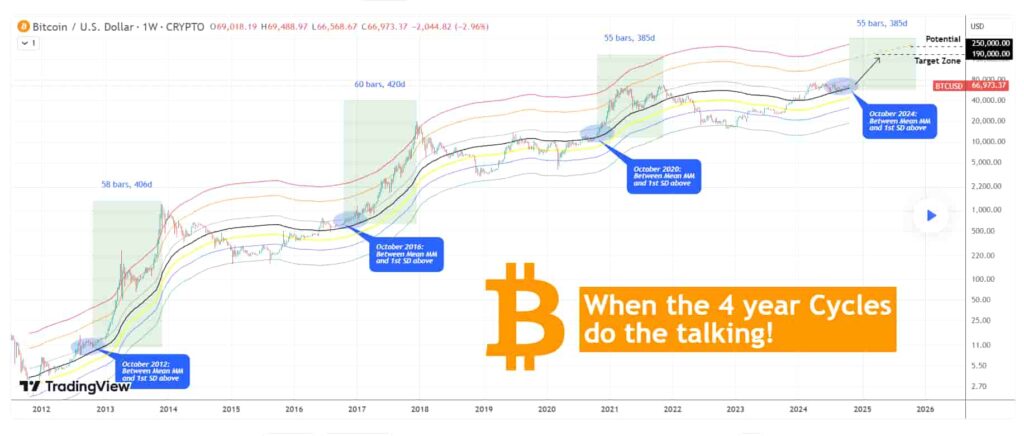
This range was also evident in October 2020, October 2016, and October 2012, showing a repeating pattern of price behavior.
In each instance, Bitcoin rallied from this position to initiate prolonged bull runs. In October 2012, Bitcoin peaked 58 weeks later; in 2016, it took 60 weeks; and in 2020, the peak occurred in 55 weeks.
If Bitcoin follows this pattern, analysts anticipate its next peak could occur by mid-November 2025, assuming it adheres to the minimum 55-week scenario. The four-year cycle suggests that the price could once again begin a parabolic rise from this point onward.
The Standard Deviation trend lines offer further insights into potential price targets for Bitcoin. In both the 2012 and 2016 cycles, Bitcoin surpassed the 3rd SD, while in 2020, it reached the 2nd SD.
Assuming a more conservative scenario where Bitcoin only reaches the second SD line, the target price range for the upcoming bull run could be between $190,000 and $250,000.

However, Bitcoin’s ability to break through the critical $70,000 resistance level is crucial for this momentum to continue. Failure to breach this level could result in a pullback, stalling the current rally and potentially pushing Bitcoin back into a consolidation phase.
These projections are grounded in historical performance, but they hinge on several key factors that will influence Bitcoin’s future trajectory.
U.S. Presidential election: A key catalyst?
One of the most discussed potential catalysts for Bitcoin’s next rally is the U.S. Presidential election. Market sentiment indicates that a Donald Trump victory could provide a significant boost to Bitcoin, with bullish outlooks already being priced in by some analysts.
On October 16, Trump launched his World Liberty Financial (WLFI) token, though it fell short of expectations.
While Bitcoin’s historical cycles and election-driven catalysts point to bullish potential, regulatory headwinds loom. The SEC has included cryptocurrencies in its examination priorities for 2025, signaling potential regulatory hurdles that could impact Bitcoin’s trajectory.
Bitcoin price analysis
As of press time, Bitcoin was trading at $66,504, a drop of almost 0.5% in the past 24 hours. The monthly chart shows gains of over 5%.
With Bitcoin on the cusp of another potential breakout, all signs point toward an exciting and volatile period ahead, possibly pushing prices well into the six-figure range.
However, despite the favorable historical precedent, investors should remain vigilant. The market is not immune to external factors, such as macroeconomic conditions or regulatory decisions, which could impact this outlook.