
Bitcoin (BTC) network activity has dropped sharply in recent months until March 27, with active addresses down over 30% since August 2025.
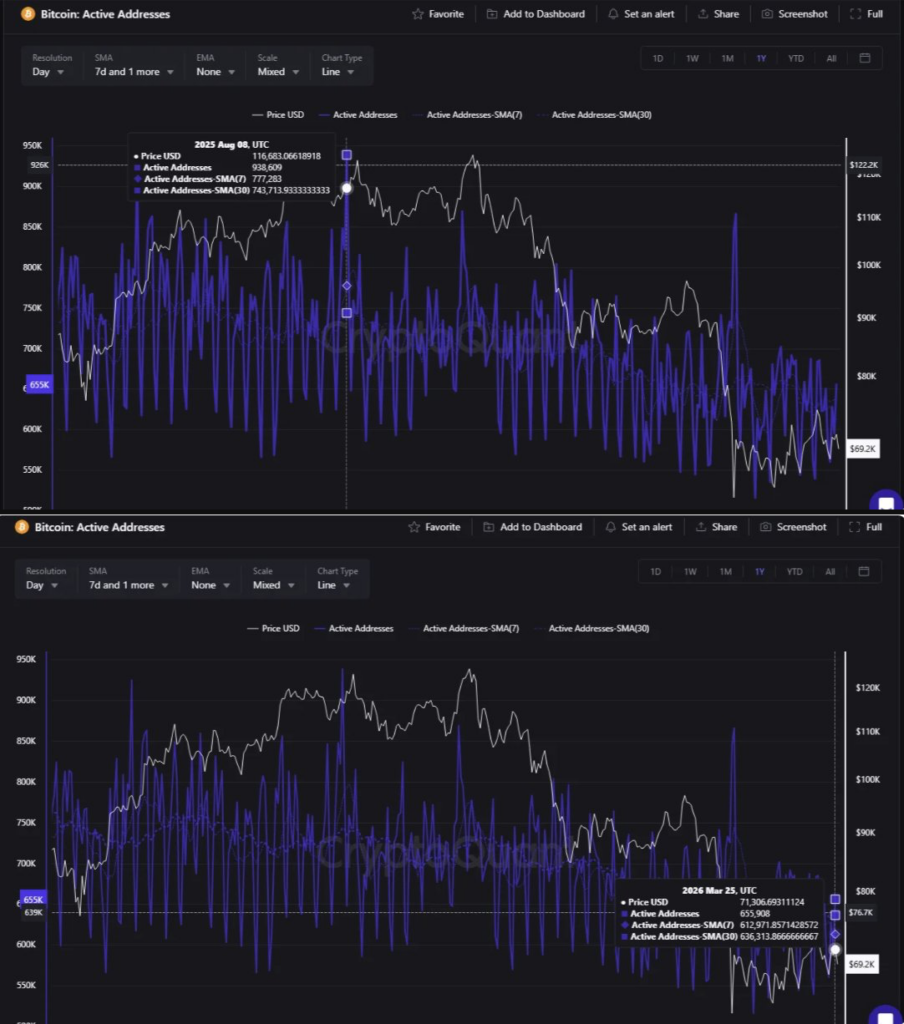
Active addresses, a measure of the number of unique addresses participating in the Bitcoin network, have fallen by over 280,000, representing a 30.1% decline, during the past 229 days, with CryptoQuant data showing around 655,900 active users as of March 25.
This significant drop in network participants, averaging a daily loss of 1,234 addresses, suggests declining user engagement, which may reinforce the medium-term bearish sentiment surrounding Bitcoin.
Backing the significant decline in BTC’s active addresses is also the seven and 30-day Simple Moving Averages (SMA). The 7-day SMA, which reflects short-term network activity, fell by 164,311 addresses to approximately 612,972 on March 25, thus representing a 21.14% decline from its August 8, 2025, level of 777,283.
Additionally, the 30-day SMA, which represents the behaviour of longer-term participants, declined by 14.44% over this period, easing to approximately 636,314 earlier this week. The shallower drop in the 30-day SMA compared to the 7-day SMA suggests that while short-term traders have stepped back significantly, longer-term network participants remain relatively more resilient.
Why are active addresses on Bitcoin dropping?
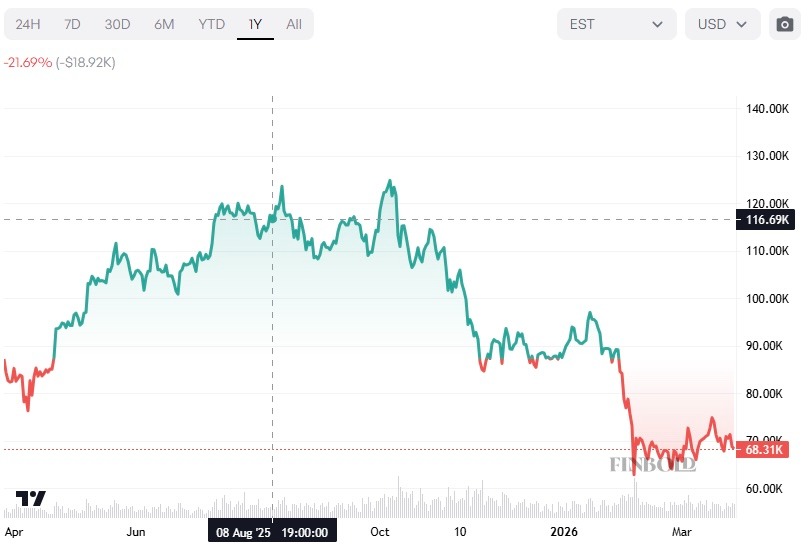
The significant pullback of Bitcoin’s active addresses over the past 229 days has coincided with bearish sentiment for the flagship coin. On August 8, 2025, BTC price traded around $116,690, but has since corrected to $68,310 at the time of reporting.
With Bitcoin’s price in a confirmed macro downtrend, similar to bear cycles in 2022 and 2018, active network participation was expected to decline. This decrease suggests weaker transaction volume and engagement, likely reducing overall network activity as speculative trading eases and retail interest cools.
Holistically, a significant drop in Bitcoin active addresses over a prolonged period has historically been associated with a collapse in market demand, and vice versa. As such, monitoring this indicator remains critical for distinguishing between a potential sustained price reversal and another dead-cat bounce.