Although Bitcoin (BTC) has started the week on a positive note, recovering from the recent losses that followed its new all-time high (ATH), the maiden cryptocurrency is inching closer to a major ‘danger zone’ in which it has historically started to make its pre-halving retraces.
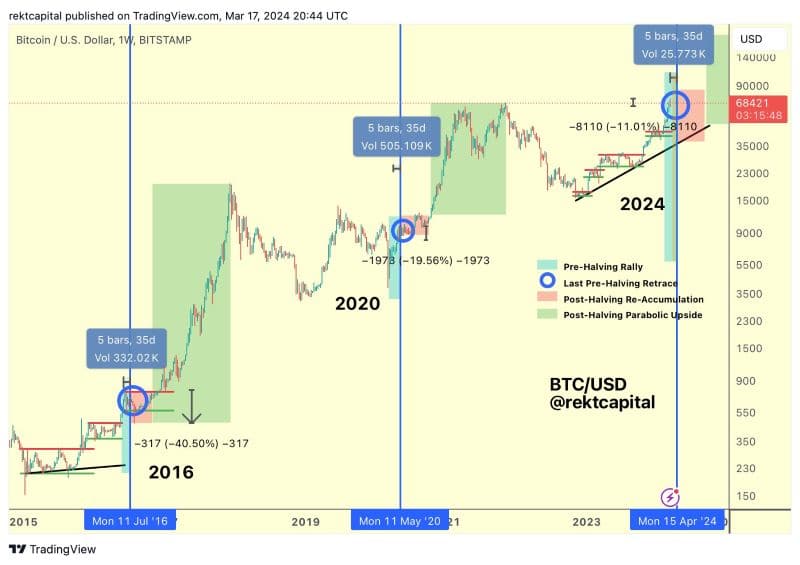
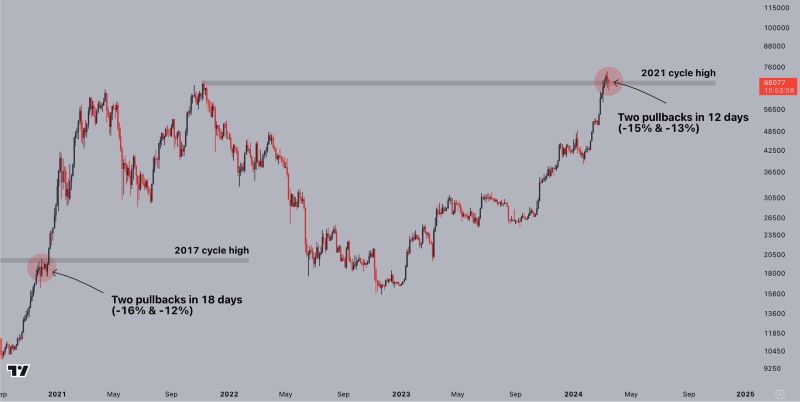
Specifically, Bitcoin has traditionally performed pre-halving retraces in the period between 14 and 28 days before its halving event, with a 40% retrace in 2016 and a 20% one in 2016, according to the observations shared by crypto trading expert Rekt Capital in an X post on March 17.
Highway to the danger zone
In other words, Bitcoin is about to enter another ‘danger zone’ in which the pre-halving retraces would typically begin, keeping in mind that the flagship decentralized finance (DeFi) asset is less than 30 days away from the halving and has already recorded a pullback last week.
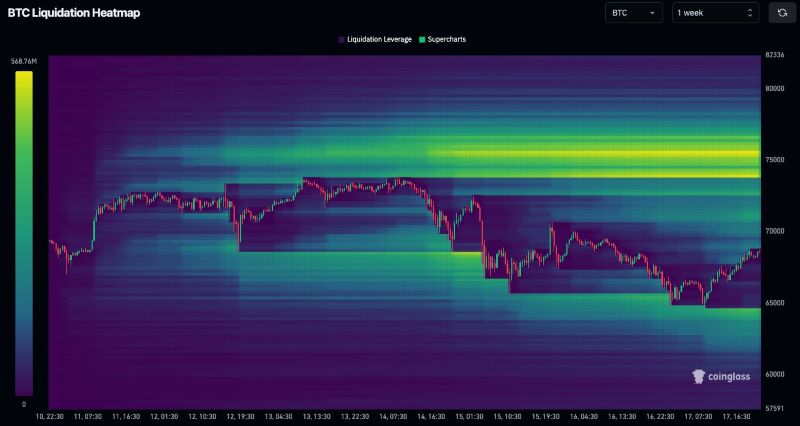
At the same time, Bitcoin has demonstrated higher levels of liquidity to the upside in the past week, leaving analysts to wonder if traders will take it now or if market makers will bring the price down first for more liquidity to build on-top, and then make a move to grab it, as Bitcoinsensus noted on March 18.
Bitcoin price analysis
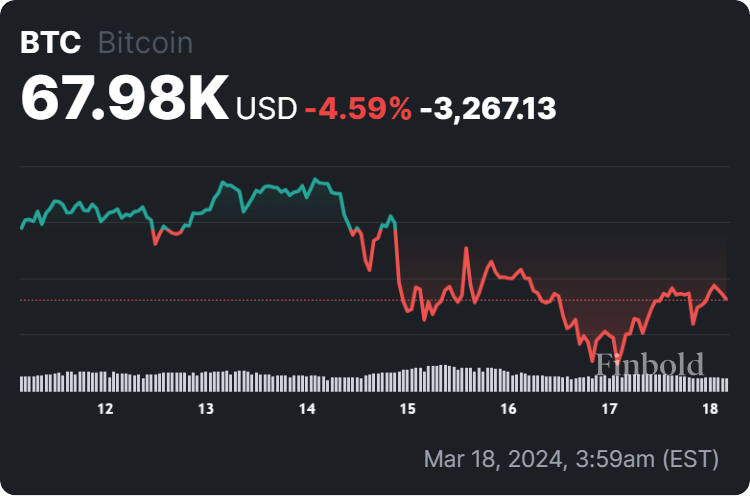
At press time, Bitcoin was changing hands at the price of $67,980, which suggests an increase of 2.36% in the last 24 hours, while declining 4.59% across the previous seven days but still holding onto the gain of 30.97% on its monthly chart, according to the latest price data.
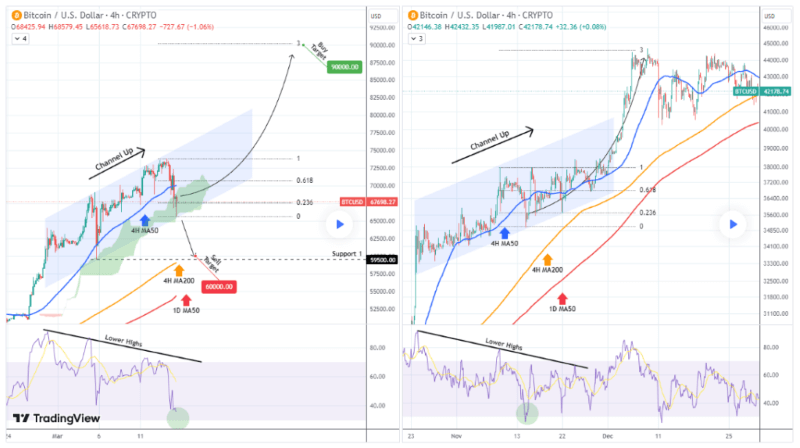
It is also worth noting that crypto expert TradingShot earlier opined that Bitcoin could see another ATH by the month’s end, as the drop to $65,000 saw it break below the four-hour MA50 and enter Ichimoku Cloud for the first time in the month, while also touching the bottom of the short-term channel up pattern.
Bitcoin price prediction
Meanwhile, in terms of specific numbers for the Bitcoin price prediction, another pseudonymous crypto analyst also noted that “history does not repeat, but it often rhymes,” sharing the expectation of Bitcoin “to take off soon” and “bring on $100,000” sometime in the future.
That said, the advanced artificial intelligence (AI) algorithms over at the crypto market monitoring platform PricePredictions have set them at $68,705 on March 31, which suggests only a modest increase of 1.07% from its current price.
Disclaimer: The content on this site should not be considered investment advice. Investing is speculative. When investing, your capital is at risk.