
Bitcoin (BTC) is currently navigating volatile waters, hovering below the $70,000 mark, with analysts highlighting parallels between the current price movement and historical patterns observed before halving events.
Notably, the market is anticipating the upcoming halving event, widely regarded as a bullish signal for Bitcoin’s long-term prospects.
In terms of the anticipated price trajectory, crypto analyst Rekt Capital cautioned investors to brace for potential extended losses in the coming weeks, as indicated in a post on X (formerly Twitter) on March 17.
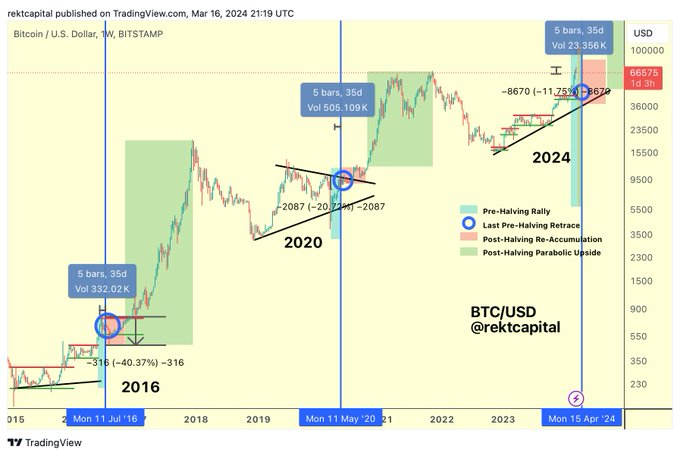
According to the analyst, Bitcoin is on the verge of entering what he termed the “danger zone,” historically marked by significant price retracements before halving events.
The analysis indicates that Bitcoin typically experiences what is termed “pre-halving retraces” days before the actual halving occurs. These retracements have been observed to range from moderate to severe dips in price.
“In 3 days, Bitcoin will officially enter the “Danger Zone” (orange) where historical Pre-Halving Retraces have begun. Historically, Bitcoin has performed Pre-Halving Retraces 14-28 days before the Halving,” he said.
Bitcoin’s pre-halving retracement
Specifically, Rekt Capital noted that in 2020, the retracement observed was around 20%, while in the lead-up to the 2016 halving, Bitcoin saw a more substantial retracement of approximately 40%. At the moment, with about 31 days to the halving, Bitcoin has retraced almost 10% from the all-time high.
Despite Bitcoin falling from its all-time high, the asset remains over 50% up on a year-to-date basis. Indeed, market uncertainty has escalated, considering that Bitcoin hit a new all-time high before the halving event. Historically, the maiden cryptocurrency has registered record highs after the bullish event.
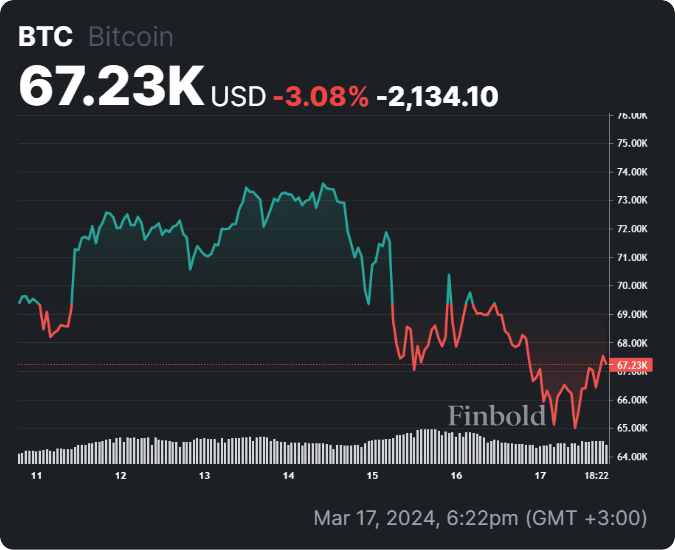
Currently, Bitcoin has dropped from its all-time high, with investors taking profits. Additionally, the asset has also been impacted after another upside surprise on U.S. inflation dimmed prospects of early rate cuts and dented demand for riskier assets.
Bitcoin price analysis
By press time, Bitcoin was trading at $67,287 with daily losses of almost 1%. Over the last seven days, BTC is down 3%.
In the meantime, a section of the market believes that Bitcoin’s volatility should not be of concern as the asset matures. In this case, some analysts opine that the advent of the Bitcoin spot exchange-traded fund (ETF) could, in theory, help reduce volatility.
Disclaimer: The content on this site should not be considered investment advice. Investing is speculative. When investing, your capital is at risk.