With Bitcoin’s (BTC) price hovering above $60,000, the maiden cryptocurrency’s technical pattern hints at a new rally that will potentially usher in a record high at the end of 2024.
Particularly, Bitcoin’s ‘cup and handle’ formation, which began after the November 2021 high, signals a bullish setup, and the recent price trajectory fits the ‘handle’ part, according to TradingShot, who made this observation in a TradingView analysis on October 4.
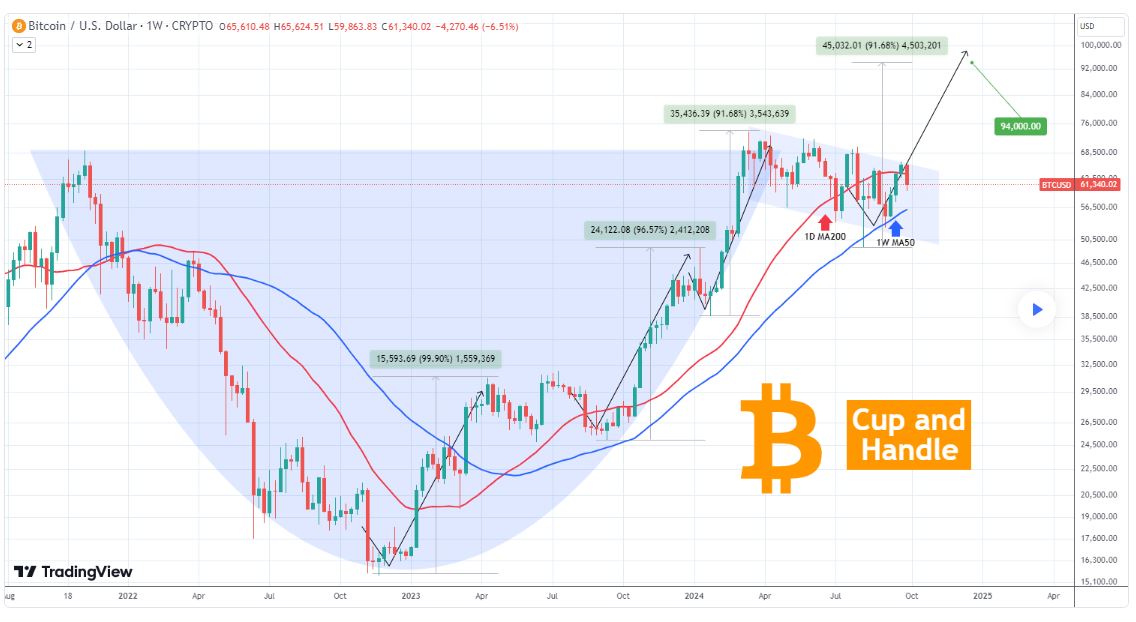
The ‘cup and handle’ pattern indicates the potential for a continuation of an asset’s previous trend. In Bitcoin’s case, the deep price correction that started in 2021 is considered the “cup,” while the ongoing downward movement since March 2024 forms the “handle.”
According to TradingShot, Bitcoin has found support on the 50-week moving average in early August and September, maintaining the bullish structure despite the temporary price pullback. This level has acted as a critical foundation for the crypto’s price, along with the MA200, which also played a role during the six-month consolidation period between August and September 2023.
Bitcoin’s next price target
All significant bullish movements since Bitcoin’s bottom in November 2022 have resulted in price increases between 90% and 100%. Therefore, TradingShot predicted that even a conservative estimate, following the minimum increase of 91.68%, could push Bitcoin’s price to at least $94,000 by the end of 2024.
“Bitcoin cup and handle on full motion looking for the break-out.<…> Even if the minimum (+91.68%) of the last rally is followed, we can expect Bitcoin to reach at least $94000 during that run by the end of the year,” the analyst said.
Interestingly, another analyst, Ali Martinez, highlighted the impact of Bitcoin’s potential breakout due to the ‘cup and handle’ pattern. As reported by Finbold, Martinez stated that the current Bitcoin price movement should be considered ‘noise.’ He noted that a large price move was forming, courtesy of the pattern, setting the next price target at $350,000.
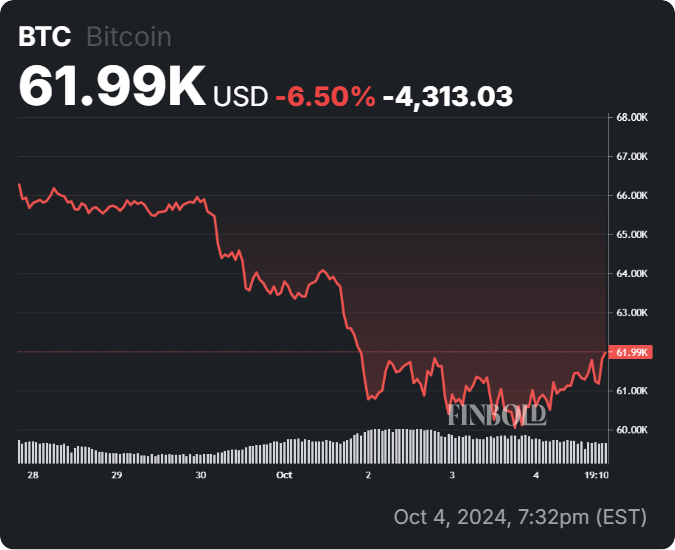
It’s worth noting that Bitcoin’s momentum to reclaim the $70,000 mark was halted after the cryptocurrency corrected in the wake of escalating geopolitical tensions in the Middle East. Interestingly, an analyst at banking giant JPMorgan (NYSE: JPM) believes the geopolitical situation will likely catalyze a Bitcoin rally.
In the meantime, there remains speculation that Bitcoin will rally in line with the ‘Uptober’ sentiment, where the asset typically trades in the green in October.
To this end, a crypto analyst with the pseudonym Ash Crypto observed in an X post on October 4 that Bitcoin had broken out from a bullish falling wedge pattern in the four-hour time frame, signaling potential upside momentum.
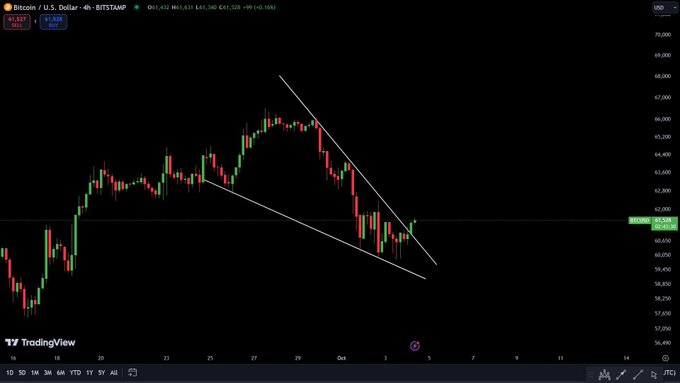
With this breakout, the analyst noted that the next crucial resistance is $64,300. If Bitcoin can successfully breach and hold above this key level, it may signal further bullish continuation for the rest of October, in line with the “Uptober” momentum.
Bitcoin price analysis
Bitcoin was trading at $61,993 by press time, gaining over 3% in the last 24 hours. On the weekly chart, BTC is down 6.5%.
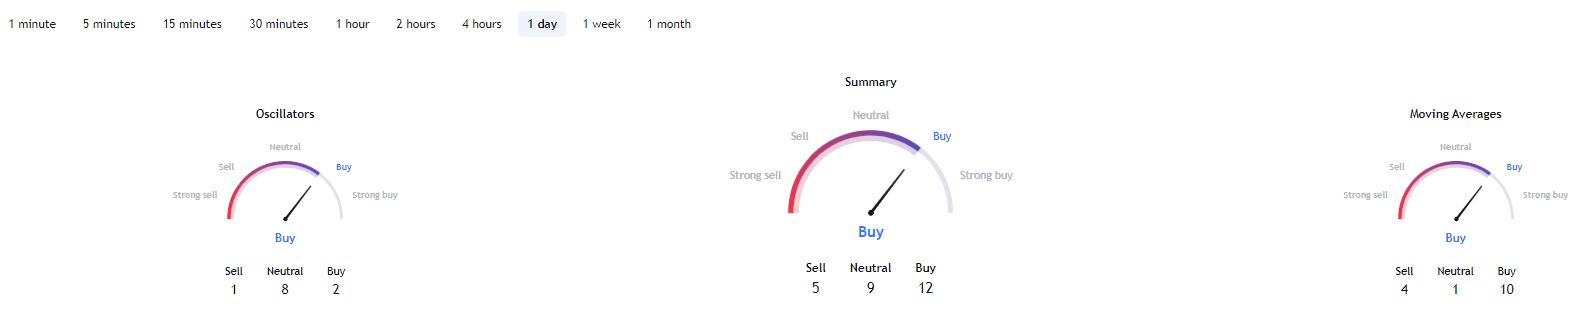
Meanwhile, Bitcoin’s technical indicators have turned bullish. A summary of moving averages and oscillators on the one-day technical chart, retrieved from TradingView, aligns with the ‘buy’ sentiment at 12, 10, and 2, respectively.
In summary, if Bitcoin can break through key resistance levels, particularly at $64,300, it may continue its bullish trend, supported by the favorable ‘Uptober’ sentiment and technical solid indicators.