

The Bitcoin Rainbow Chart points to a potential 27% correction toward $59,000 in early November as the cryptocurrency struggles to recover above $82,000.
At its press-time price of $81,703, BTC would need to lose about $22,670 to reach $59,033, according to the Coinglass Bitcoin Rainbow Chart.
The indicator uses a logarithmic growth curve and nine color-coded valuation zones to assess Bitcoin’s price against its historical trend.
For November 2, 2026, the blue Fire Sale! zone stands at $111,536, indicating extreme undervaluation relative to the model’s trend.
The BUY! level at $151,600 suggests an attractive entry point, while the green Accumulate zone at $208,115 signals a potential opportunity to build exposure gradually. The light-green Still Cheap level at $280,956 indicates that BTC remains relatively inexpensive under the model.
The yellow HOLD zone sits at $379,292, representing a more balanced valuation. Above it, the yellow-orange Is This a Bubble? level at $521,091 signals potential overvaluation.
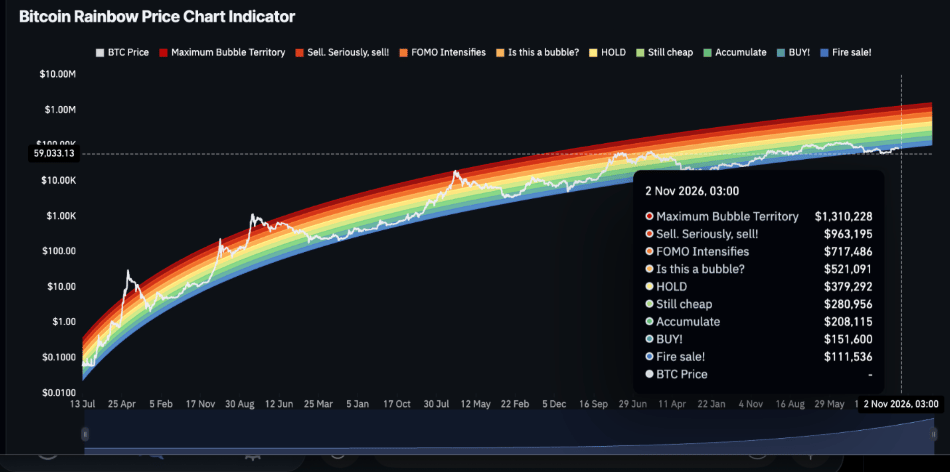
The FOMO Intensifies zone at $717,486 reflects heightened speculative demand, while the red-orange Sell. Seriously, sell! level at $963,195 warns of excessive valuations. At the top, the red Maximum Bubble Territory zone stands at $1,310,228, representing the model’s most overheated valuation.
These projected thresholds are substantially above Bitcoin’s current price, but they do not directly predict a crash below $60,000. Such a decline would represent a bearish scenario in which selling pressure intensifies despite the model’s higher long-term valuation levels.
Bitcoin struggles above $82,000
Bitcoin’s price action adds to uncertainty surrounding its November outlook. BTC fell below $82,000 on Tuesday as elevated oil prices and geopolitical tensions weighed on market sentiment.
The maiden cryptocurrency had climbed above $83,000 in the previous session but failed to hold those gains. It has also struggled to recover after retreating from above $85,000 earlier in October.
Meanwhile, Brent crude futures rose to $111.05 per barrel, a five-month high, as investors assessed the impact of higher energy prices on inflation and the Federal Reserve’s interest-rate outlook. Persistent inflation and expectations of tighter monetary policy could weigh on demand for risk-sensitive assets such as cryptocurrencies.
Bitcoin technical outlook
Technically, Bitcoin is trading slightly above its 50-day simple moving average (SMA) of $81,429, suggesting relatively stable short-term momentum. It also remained above its 200-day SMA of $72,528, indicating that its longer-term trend remained bullish.
The 14-day relative strength index (RSI) stood at 48.58, near neutral territory but below the 50 mark, suggesting slightly bearish momentum.
However, the indicator remained well above the oversold threshold of 30. Overall, Bitcoin’s technical outlook was mixed, with its longer-term trend intact but limited evidence of strong bullish momentum in the short term.
Featured image via Shutterstock