

Bitcoin (BTC) remains significantly below its long-term valuation trend, according to the Bitcoin Rainbow Chart, which places the cryptocurrency beneath even its lowest projected valuation band for August 31.
The indicator, tracked by CoinGlass, shows the chart’s ‘Fire Sale’ band rising to $105,087 by month-end, while Bitcoin is currently trading at $64,092. The gap highlights how far BTC remains below the levels implied by the model’s historical logarithmic growth curve.
Notably, Bitcoin would need to rally about 64% in less than a month to reach the ‘Fire Sale’ threshold.
As a result, the chart should not be interpreted as predicting a move to $105,000 by August 31. Instead, it suggests Bitcoin is trading at a substantial discount to its long-term trend.
BTC price prediction
The Rainbow Chart divides Bitcoin into several valuation zones that correspond to different stages of the market cycle and investor sentiment.
At the bottom of the scale is the ‘Fire Sale’ band at $105,087, a zone historically associated with extreme undervaluation and weak sentiment. Above it is the ‘BUY’ band at $142,835, indicating attractive valuations where Bitcoin is considered significantly undervalued relative to historical growth patterns.
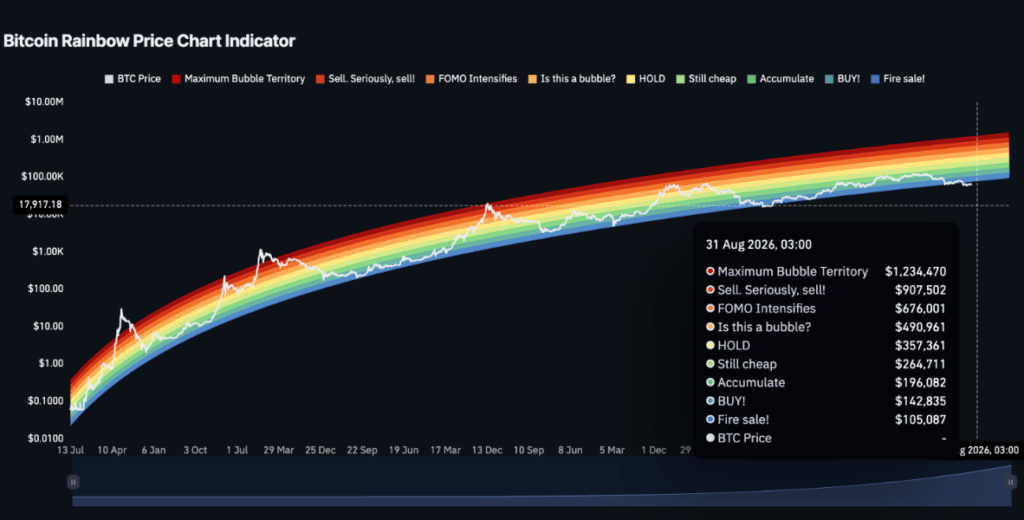
The ‘Accumulate’ band stands at $196,082 and represents a region where long-term investors may gradually build positions.
Next is the ‘Still Cheap’ band at $264,711, suggesting Bitcoin remains undervalued despite trading at much higher levels than in previous market cycles.
The ‘HODL’ band sits at $357,361 and is generally viewed as the chart’s fair-value zone, where Bitcoin aligns more closely with its long-term growth trajectory.
Above the neutral range is the ‘Is this a bubble?’ band at $490,961, indicating that prices may be becoming increasingly stretched and speculative. The ‘FOMO Intensifies’ band at $676,001 reflects accelerating investor enthusiasm and fear of missing out.
‘The Sell. Seriously, sell!’ band stands at $907,502, signaling extreme valuations and elevated correction risk. At the top of the chart is ‘Maximum Bubble Territory’, which reaches approximately $1.23 million and represents conditions of peak market euphoria and unsustainable speculation.
The latest reading suggests Bitcoin is trading well below the Rainbow Chart’s long-term valuation range. Although the indicator is not a price forecast, it shows BTC remains nearly $41,000 below the chart’s lowest August band of $105,087, indicating the cryptocurrency is still in a deep undervaluation zone rather than the speculative territory associated with previous market peaks.
Bitcoin price analysis
By press time, Bitcoin was trading at $64,092, up nearly 1% in the last 24 hours, although it remains down 0.44% over the past week.
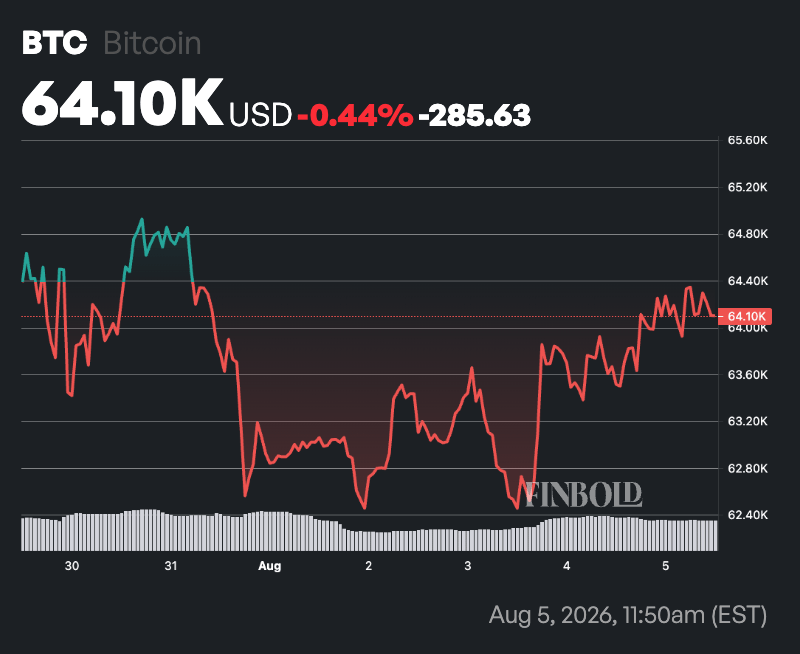
From a technical perspective, Bitcoin is showing a neutral outlook. BTC is trading slightly above its 50-day SMA of $63,315, indicating short-term momentum remains positive.
However, it is still below the 200-day SMA of $70,850, suggesting the broader trend remains under pressure and a long-term bullish reversal has yet to be confirmed.
Meanwhile, the 14-day RSI stands at 50.63, a neutral reading that signals neither overbought nor oversold conditions.
Together, the SMA and RSI suggest Bitcoin is consolidating, with buyers maintaining short-term support but lacking enough momentum to challenge the longer-term downtrend.