
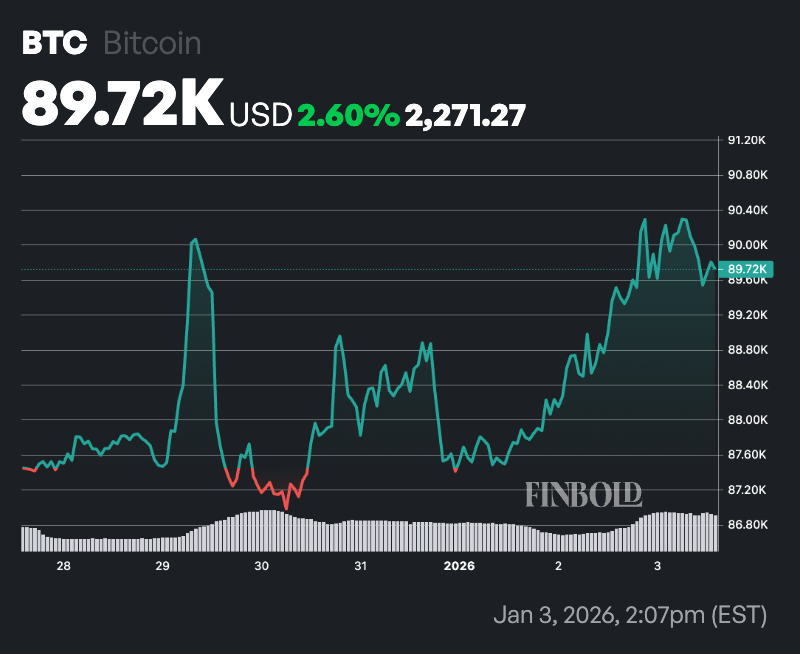
As Bitcoin (BTC) hovers around the $90,000 level, the asset’s Rainbow Chart projects a wide range of possible price outcomes for January 31, 2026.
The chart’s highest valuation band, ‘Maximum Bubble Territory’, spans roughly $334,173.88 to $449,435.85 and is historically associated with extreme overvaluation and late-cycle market euphoria.
Just below it, the ‘Sell, Seriously, SELL!’ zone ranges from about $256,680.28 to $334,173.88, signaling conditions where long-term returns have historically weakened, and downside risk increased.
The ‘FOMO intensifies’ band places Bitcoin between approximately $200,285.53 and $256,680.28, reflecting periods of accelerating retail participation and momentum-driven buying.
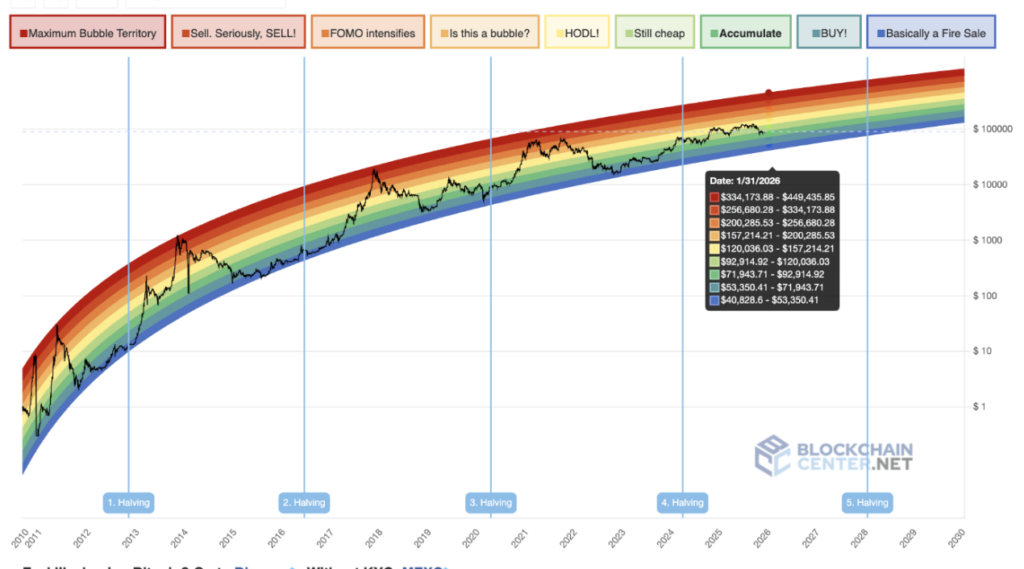
Below that, the ‘Is this a bubble?’ level, running from around $157,214.21 to $200,285.53, points to elevated prices that often spark debate over sustainability without necessarily marking a market peak.
The ‘HODL!’ zone, spanning roughly $120,036.03 to $157,214.21, represents valuations where long-term holders have historically been inclined to maintain positions amid strong but not excessive optimism.
Further down, the ‘Still cheap’ band places the cryptocurrency between about $92,914.92 and $120,036.03, implying prices that in past cycles have offered favorable long-term risk-reward.
The ‘Accumulate’ zone ranges from approximately $71,943.71 to $92,914.92 and reflects levels where investors have historically increased exposure during subdued sentiment.
Below that, the ‘BUY!’ category spans roughly $53,350.41 to $71,943.71, a range associated with broad undervaluation in prior cycles. At the lowest end, the ‘Basically a Fire Sale’ zone places Bitcoin between about $40,828.60 and $53,350.41, representing deep-value territory that has historically aligned with strong long-term entry points after major drawdowns.
Bitcoin’s possible Jan 31 price
Taken together, the Rainbow Chart does not forecast a specific Bitcoin price for January 31, 2026, but outlines sentiment-based valuation bands that frame potential upside and downside scenarios.
With Bitcoin currently trading at $89,777, the chart suggests a plausible path into late January 2026, within the ‘Still cheap’ or ‘HODL!’ zones, corresponding to roughly $93,000 to $157,000 if BTC continues to follow its historical growth curve.
A stronger post-halving advance could lift prices into the Is this a bubble? or ‘FOMO intensifies ‘bands, implying a range of about $157,000 to $256,000, while a move into the uppermost bands would likely require conditions consistent with past cycle peaks rather than the current trend.
Featured image via Shutterstock