
Bitcoin’s (BTC) Rainbow Chart has issued fresh insights into how the asset will likely start June, just days after clinching a record high.
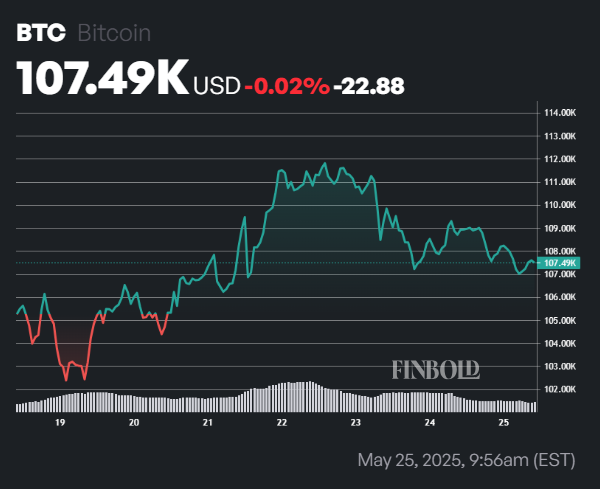
Notably, this comes as Bitcoin’s bullish run has hit a bump. The asset lost the $110,000 support after briefly soaring above an all-time high of above $111,000 mid-week, a surge driven largely by institutional capital inflows.
As of press time, Bitcoin was trading at $107,498, down 1.2% in the last 24 hours but up nearly the same value over the past week.
Amid the current momentum, Bitcoin is approaching overbought territory as the 14-day relative strength index (RSI) reads 63.
However, the short- and long-term outlooks remain bullish, with the 50-day and 200-day simple moving averages (SMA) sitting lower at $94,730 and $86,569, respectively.
Bitcoin price prediction for June 1
The Bitcoin Rainbow Chart, using a logarithmic growth curve to illustrate investor sentiment across price levels, offers a glimpse into what might lie ahead for June 1. Its nine color-coded zones span from “Bitcoin is dead” (severe bearishness) to “Maximum Bubble Territory” (extreme overvaluation).
According to the chart, Bitcoin is projected to trade between approximately $32,787 and $372,813 on June 1, with each band representing a distinct level of sentiment.
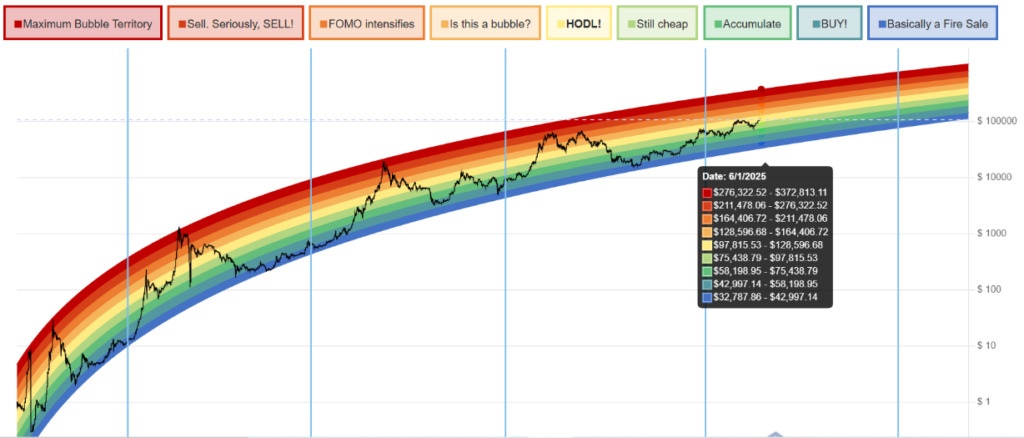
At the lower end, prices below $43,000 suggest a “Basically a Fire Sale,” signaling that Bitcoin could be severely undervalued. The $43,000 to $58,000 range, the chart indicates a “BUY!” zone, encouraging accumulation.
Moving higher, the $58,000 to $75,000 band reflects the “Accumulate” zone, suggesting cautious optimism.
Between $75,000 and $97,800, the sentiment shifts to “Still cheap,” indicating that Bitcoin remains reasonably priced for long-term holders.
Next, the $97,800 to $128,600 range enters the“HODL!” phase, a call to resist the urge to sell. Given the current price, this level is the most likely scenario for June 1.
Beyond that, prices between $128,600 and $164,400 raise the question, “Is this a bubble?” hinting at potential overheating.
Bitcoin’s extreme bullish zone
If Bitcoin climbs into the $164,400 to $211,400 range, the market may experience intensified FOMO (Fear of Missing Out). A further surge into the $211,400 to $276,300 band would call for serious caution with a “Sell. Seriously, SELL!” label.
Finally, prices between $276,300 and $372,800 would place Bitcoin in the “Maximum Bubble Territory,” indicating extreme overvaluation.
Although the Rainbow Chart provides an insightful visualization of Bitcoin’s historical price behavior, it’s not a precise predictive tool.
It extrapolates long-term trends based on logarithmic growth, but unpredictable factors like macroeconomic events, regulations, and technological changes can impact future prices. Still, it is a valuable guide for investors and traders gauging Bitcoin’s potential trajectory.
Featured image via Shutterstock