
The Bitcoin (BTC) Rainbow Chart has outlined potential price ranges for October 1, 2025, as the asset seeks to reclaim the $120,000 resistance.
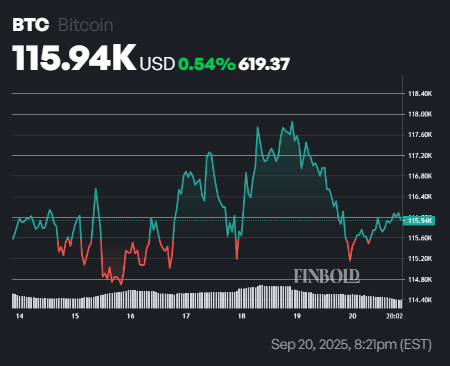
Throughout September, the maiden cryptocurrency has struggled to push past the $115,000 support zone. At press time, Bitcoin was trading at $115,950, up 0.15% in the past 24 hours and gaining a modest 0.5% over the past week.
Looking ahead to October 1, the Rainbow Chart projects that Bitcoin’s price could fall within a broad band of $36,628 to $409,726, depending on prevailing market sentiment.
The Rainbow Chart, a long-term valuation model often used to track Bitcoin’s price cycles, is built as a logarithmic regression chart. It color-codes Bitcoin’s valuation bands, offering investors a simplified way to gauge whether the market is undervalued or overheated.
Bitcoin price prediction
The lowest tier, labeled “Basically a Fire Sale,” spans from $36,628 to $47,947. Above that, the “BUY!” zone ranges from $47,947 to $64,777, while “Accumulate” covers $64,777 to $83,811.
The “Still Cheap” band sets Bitcoin between $83,811 and $108,471, followed by the neutral “HODL!” zone at $108,471 to $142,332.
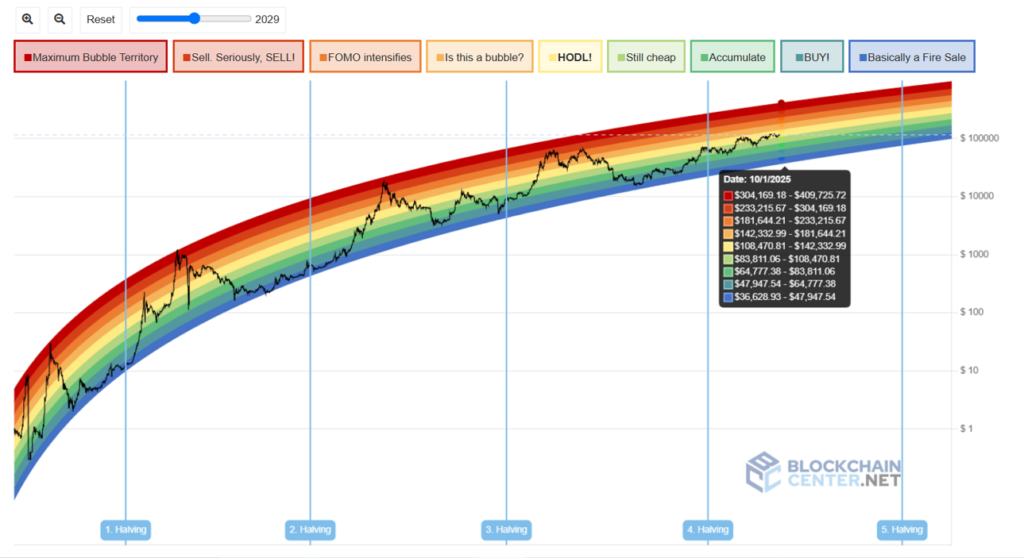
Cautionary levels emerge as prices climb higher. In this case, the “Is this a bubble?” range extends from $142,332 to $181,644, while “FOMO intensifies” lies between $181,644 and $233,215.
On the other hand, the red zones, seen as overheated territory, start with “Sell. Seriously, SELL!” at $233,215 to $304,169 and peak with “Maximum Bubble Territory” from $304,169 to $409,726.
With Bitcoin trading around $116,000 as of September 20, the Rainbow Chart suggests that by October 1, 2025, the asset will most likely fall within the “Still Cheap” or “HODL!” bands, implying a fair value between $83,811 and $142,332.
This outlook indicates that despite Bitcoin’s strong gains, the model places its current trajectory within reasonable valuation territory, rather than at bubble levels.
Featured image via Shutterstock