
With Bitcoin attempting to put aside the recent market correction, historical data points to an imminent upward reversal as the asset potentially finishes up the formation of a bullish momentum.
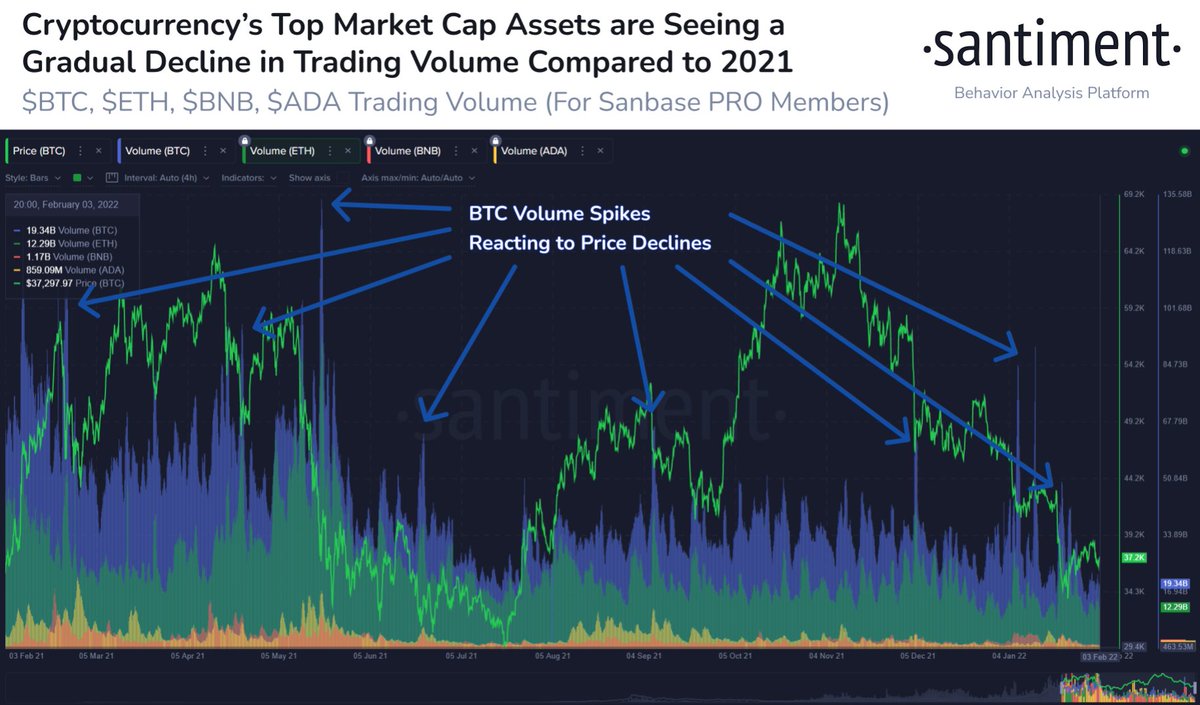
Currently, Bitcoin is replicating the trading movement witnessed over the past year where the asset registered a surge in trading volume after a drop in value, data provided by cryptocurrency on-chain analysis platform Sentiment indicates.
Moments of such trading volume drop have appeared attractive to the bulls amid reduced interest among retailers investors, pointing to a possible upward reversal.
Although Bitcoin began the year under high volatility, the asset has managed to form a series of bearish and bullish price movements below the $40,000 mark resulting in the formation of a broadening falling wedge (or descending broadening wedge).
Popular crypto YouTuber Crypto Zombie points out that Bitcoin is currently under the broadening falling wedge based on the asset’s four-hour chart. Historically, the position forms a final partial decline before taking off to retest highs with $40,000 the current crucial target.
If the level is breached, the bull market will likely be back on even more momentum than before.

With Bitcoin price currently in a descending broadening wedge (on a 4-hour price chart), Crypto Zombie notes that historically such scenarios have resulted in a break out. Based on the point where Bitcoin began forming the latest broadening falling wedge, the bearish and bullish trajectory could culminate in Bitcoin potentially trading at around the $52,000 mark.

In the last two months, Bitcoin has been trading below the record high at $69,000 set in November 2021. Consequently, the asset wiped out over 50% of its profits and at some point plunged below its 50-week exponential moving average.
The $30,000 support level
Amid the drop, Bitcoin has found a major support level at the $30,000 mark. Since last January, the price has been capping the cryptocurrency’s downside attempts. Worth mentioning is that the level acted as a critical point for attracting interest in the asset.
Following the crash, bears have been unable to push the price per BTC any lower than $30,000, while bulls have been equally as weak, causing Bitcoin to form a potential broadening falling wedge.
If Bitcoin can reclaim the $40,000 mark, the bull market will likely be back with more momentum than before.
Worth mentioning is that if the bullish reversal is attained, it will be the critical test of whether Bitcoin is in a bear market or not.