
A cryptocurrency trader has incurred massive losses of over $2 million after holding Ethereum (ETH) for nearly a year.
The long-term Ethereum investor capitulated, locking in a staggering $2.6 million loss in a transaction initiated within 30 minutes, according to the latest on-chain data retrieved by Finbold from Arkham Intel on April 16.
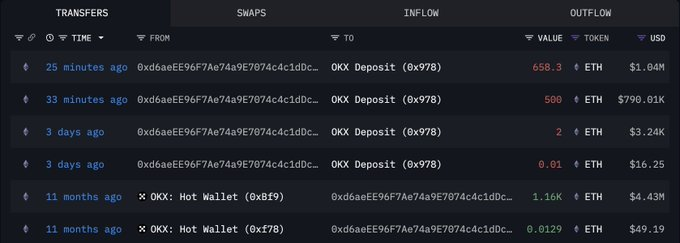
The unidentified trader initially withdrew 1,160 ETH valued at $4.43 million from the OKX cryptocurrency exchange 11 months ago. At the time, Ethereum was changing hands at $3,816.
The ETH was then transferred to a self-custody wallet, suggesting a long-term investment strategy or an anticipation of higher prices.
30 mins of capitulation
However, on April 16, within just 30 minutes, the same wallet sent the full amount of ETH back to OKX in three major deposits, 658.3 ETH, 500 ETH, and 2 ETH, at an average exit price of around $1,580, totaling $1.83 million.
Arkham’s analysis indicated that this fire-sale level price represented a 58.6% drop from the entry point, resulting in a realized loss of approximately $2.6 million.
Adding to the trail of capitulation, a small fraction of 0.01 ETH was also sent, likely as a test transaction. As of press time, the investor’s wallet held Ethereum valued at just $2.56.
it remains unclear what triggered the sudden liquidation, whether fear of further losses or a strategic portfolio rebalancing, the scale and speed of the sale are notable.
This comes when Ethereum has mostly faced sustained downward pressure after losing the $2,000 support level.
At the time of reporting, the second-ranked cryptocurrency by market cap was trading at $1,571, having dropped 2.5% on the day, though ETH remains up 6.5% over the past seven days.
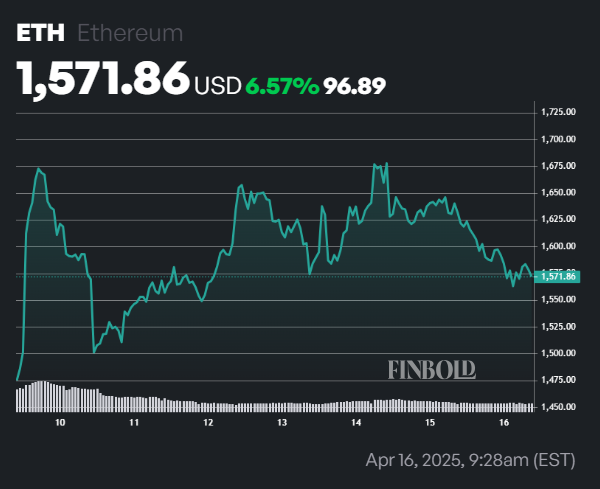
Ethereum is currently trading significantly below its 50-day and 200-day simple moving averages (SMA). This positioning beneath key moving averages signals a strong bearish trend, with the asset underperforming its medium, and long-term price momentum.
Featured image via Shutterstock