

The Ethereum Rainbow Chart is suggesting that ETH could remain near the lower end of its historical valuation range by October 31, 2026.
With Ethereum (ETH) trading at $2,700, the asset sits just above the model’s “Accumulate” threshold and well below the “Still Cheap” level, indicating it remains far from conditions typically associated with market overheating.
In the latest reading for late October 2026, the lowest band, “Basically a Fire Sale,” extends to about $1,153.15 and has historically marked periods of extreme undervaluation. Above it sits the “BUY!” zone, which reaches approximately $1,729.73.
The next band, “Accumulate,” tops out near $2,594.59. Ethereum is currently trading slightly above this level. Above that lies the “Still Cheap” band, which extends to roughly $3,891.88 and has historically represented attractive long-term entry levels before stronger bull market advances.
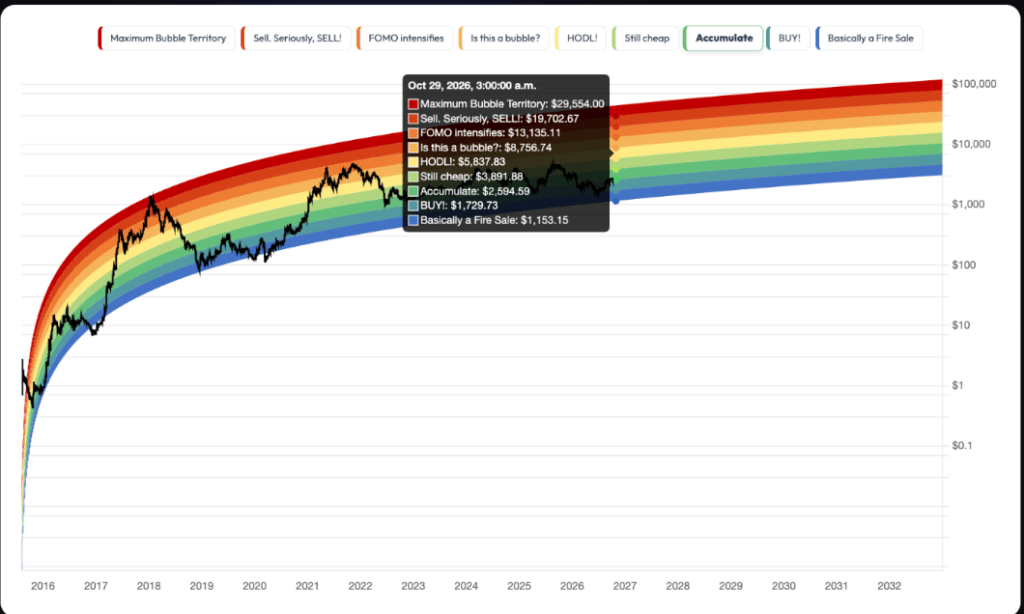
The model then moves into the “HODL!” range, which reaches approximately $5,837.83. Higher still are the “Is this a bubble?” band at $8,756.74 and the “FOMO intensifies” zone at $13,135.11.
The final two bands are “Sell. Seriously, SELL!” at $19,702.67 and “Maximum Bubble Territory” above $29,554, levels typically associated with extreme speculative conditions.
The Ethereum Rainbow Chart is a logarithmic valuation model that maps ETH’s historical price performance across a series of color-coded bands reflecting different market sentiment phases.
Ethereum’s November outlook
Based on Ethereum’s current position within the Rainbow Chart, a reasonable target range for the end of November 2026 would be between $2,800 and $3,300.
Such a move would keep ETH within the lower half of the model’s valuation structure while reflecting continued demand from retail and institutional investors.
A stronger rally could see the cryptocurrency move closer to the lower boundary of the “Still Cheap” zone near $3,900.
However, reaching that level would likely require additional catalysts, including sustained ETF inflows, stronger network activity, and continued growth in tokenized real-world assets.
Ethereum price analysis
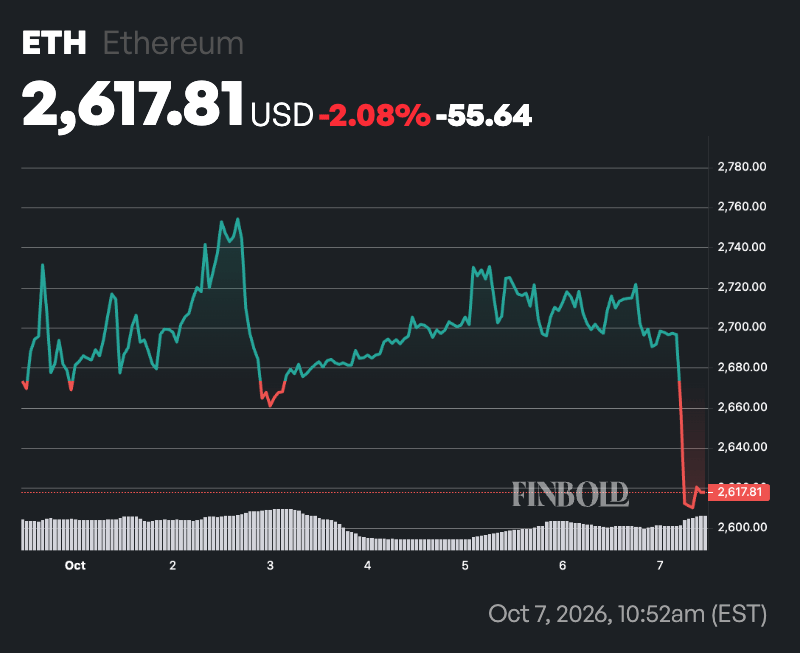
By press time, Ethereum was trading at $2,711, down 0.28% over the past 24 hours. On the weekly timeframe, the cryptocurrency was also lower by 2%.
Ethereum’s broader market structure remains bullish. The cryptocurrency is trading above its 50-day simple moving average (SMA) of $2,533.24 and its 200-day simple moving average of $2,123.95, reinforcing the strength of the prevailing uptrend.
Meanwhile, the 14-day Relative Strength Index (RSI) stood at 60.14, indicating neutral momentum and suggesting Ethereum has yet to enter overbought territory.
Featured image via Shutterstock