

Skip to content

To keep going please Log in.

or

By submitting my information, I agree to the Privacy Policy and Terms of Service.

To keep going please Log in.

or

By submitting my information, I agree to the Privacy Policy and Terms of Service.

To keep going please Log in.

or

By submitting my information, I agree to the Privacy Policy and Terms of Service.

To keep going please Log in.

or

By submitting my information, I agree to the Privacy Policy and Terms of Service.

Ethereum Rainbow Chart predicts ETH price for end of September 2026

Ethereum Rainbow Chart predicts ETH price for end of September 2026
Paul L.

The Ethereum (ETH) Rainbow Chart suggests ETH could trade at approximately $2,551 by the end of September 2026, placing the cryptocurrency in the model’s Accumulate zone. 

With Ethereum trading around $2,400 as of press time, the projection implies a potential upside of about 6% over the remainder of the month.

Notably, the outlook is based on BlockchainCenter’s Ethereum Rainbow Chart, a long-term valuation model that uses Ethereum’s price history since 2015 to assess whether ETH is trading below, near, or above its historical growth trend.

According to the September 2026 Rainbow Chart bands, ‘Basically a Fire Sale’ ($1,134) signals extreme undervaluation; ‘BUY!’ ($1,700) indicates a buying opportunity, ‘Accumulate’ ($2,551) suggests gradual accumulation, and ‘Still cheap’ ($3,826) points to continued undervaluation. 
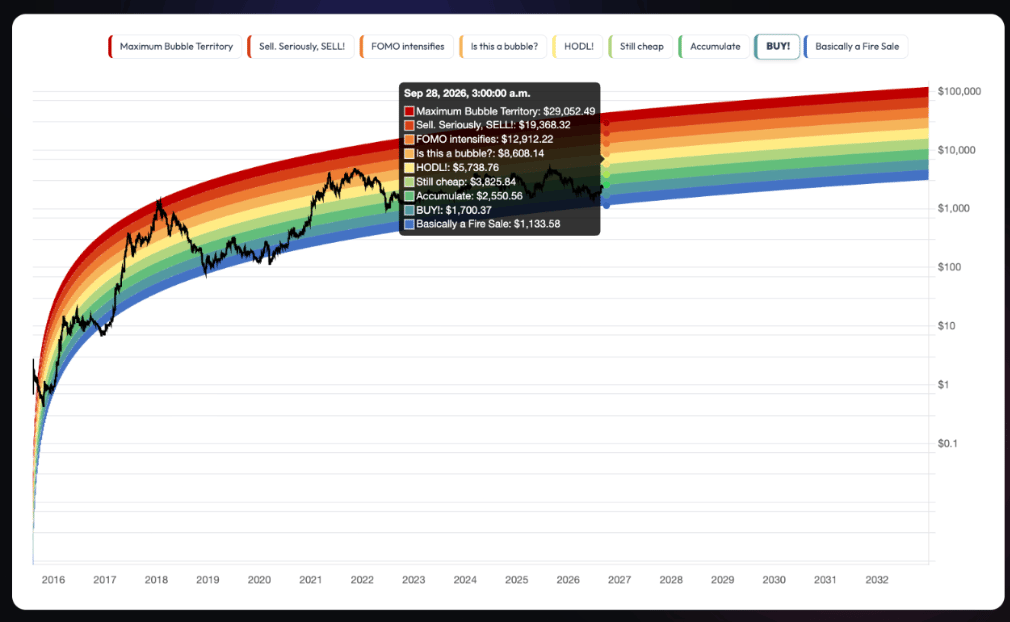
Ethereum Rainbow Chart. Source: Blockchain Centre

Higher bands include ‘HODL!’ ($5,739), which reflects fair-value holding territory. ‘Is this a bubble?’ ($8,608), which signals rising speculation, and ‘FOMO Intensifies’ ($12,912), where investor exuberance becomes more pronounced. 

The top bands: ‘Sell. Seriously, SELL!’ ($19,368) and ‘Maximum Bubble Territory’ ($29,052), indicate historically overheated market conditions.

Ethereum price analysis

The prediction comes as Ethereum retreats from recent highs above $2,500, which coincided with a broader cryptocurrency market rally led by Bitcoin (BTC). 

At press time, ETH was trading at $2,368, down about 3.4% over the past 24 hours and 3.2% on the weekly timeframe.
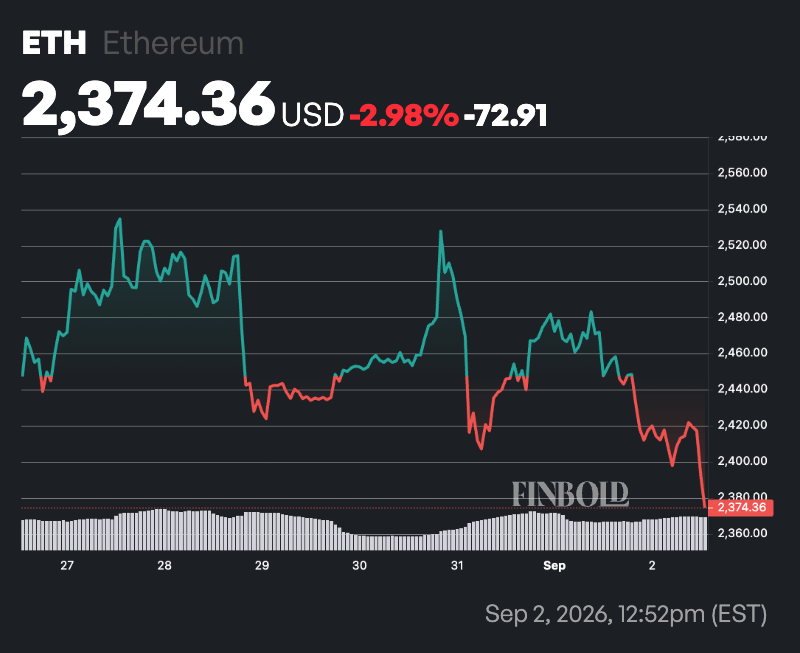
ETH seven-day price chart. Source: Finbold

Even so, Ethereum remains in a technically strong position despite the bearish sentiment. The asset continues to trade well above its 50-day SMA of $2,043 and 200-day SMA of $2,027, indicating that the medium- and long-term trends remain bullish.

Momentum also remains supportive, with the 14-day RSI at 63.92. While still in neutral territory, the indicator is approaching overbought levels, suggesting buyers remain in control even as the pace of gains may begin to moderate.

Featured image via Shutterstock

Best Crypto Exchange for Intermediate Traders and Investors

  • Invest in cryptocurrencies and 3,000+ other assets including stocks and precious metals.

  • 0% commission on stocks - buy in bulk or just a fraction from as little as $10. Other fees apply. For more information, visit etoro.com/trading/fees.

  • Copy top-performing traders in real time, automatically.

  • eToro USA is registered with FINRA for securities trading.

30+ million Users worldwide
Securities trading offered by eToro USA Securities, Inc. (“the BD”), member of FINRA and SIPC. Cryptocurrency offered by eToro USA LLC (“the MSB”) (NMLS: 1769299) and is not FDIC or SIPC insured. Investing involves risk, and content is provided for educational purposes only, does not imply a recommendation, and is not a guarantee of future performance. Finbold.com is not an affiliate and may be compensated if you access certain products or services offered by the MSB and/or the BD
Finbold Career

Join Finbold's newsroom, become a Sales Executive today!

Apply now to join Finbold as a crypto/finance news writer!

Latest posts

Finance Digest

By subscribing you agree with Finbold T&C’s & Privacy Policy

Related posts

Home

IMPORTANT NOTICE

Finbold is a news and information website. This Site may contain sponsored content, advertisements, and third-party materials, for which Finbold expressly disclaims any liability.

RISK WARNING: Cryptocurrencies are high-risk investments and you should not expect to be protected if something goes wrong. Don’t invest unless you’re prepared to lose all the money you invest. (Click here to learn more about cryptocurrency risks.)

By accessing this Site, you acknowledge that you understand these risks and that Finbold bears no responsibility for any losses, damages, or consequences resulting from your use of the Site or reliance on its content. Click here to learn more.