
Ethereum (ETH) is once again stealing the cryptocurrency market spotlight, with the asset now targeting the $4,000 level.
To this end, according to analysis by charting platform TrendSpider, Ethereum is on the verge of a breakout supported by bullish technical indicators.
In a July 8 post on X, TrendSpider noted that after reclaiming $3,800, Ethereum is having its “main character moment.”
The outlook shows that after months of accumulation between $2,000 and $3,000, Ethereum finally broke above the key resistance zone around $3,000 and $3,200 in mid-July. This breakout unleashed strong buying momentum, pushing ETH to highs near $3,800.
The platform’s analysis identified a well-formed cup-shaped pattern that developed over the past six months, which often precedes significant upside moves. The volume profile indicates significant prior trading activity in the $2,500 to $3,000 zone, suggesting that former resistance has become strong support.
Ethereum price levels to watch
At the same time, market sentiment remains upbeat. A TrendSpider poll also found that 80.5% of respondents expect Ethereum to reach $4,000 in 2025, with 41% predicting $5,000 and 26.5% targeting $6,000. More bullish projections see ETH climbing to $7,000 (17.5%) or even $8,000 (13.5%).
Ethereum’s momentum is also being fueled by institutional inflows and whale activity. For instance, on July 18, Ethereum ETFs recorded $402.5 million in net inflows, surpassing Bitcoin’s $363.4 million, with BlackRock’s ETHA driving 98% of the activity and pushing total ETH ETF assets to $18.37 billion.

On-chain data showed a whale purchased 13,462 ETH (about $50 million) at $3,715. In comparison, futures open interest rose 12.79% month-over-month to $786 billion, with leveraged traders such as James Wynn reportedly taking $12.1 million in 25x long positions.
Ethereum price analysis
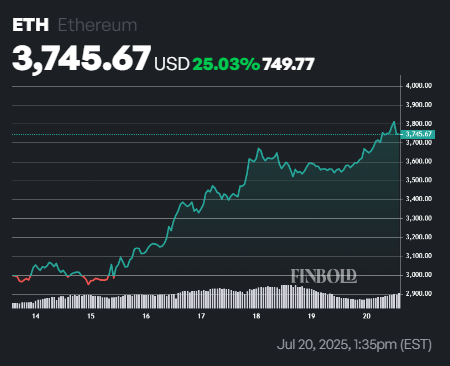
At press time, the second-largest cryptocurrency by market capitalization was trading at $3,745, up more than 5% in the last 24 hours and 25% over the past week.
At current levels, Ethereum remains in a strong uptrend, trading above its 50-day simple moving average (SMA) of $2,674 and 200-day SMA of $2,357. However, the 14-day RSI at 84 indicates overbought conditions, suggesting a short-term pullback could occur despite the bullish momentum.
Featured image via Shutterstock