
As Bitcoin (BTC) seeks to break through the $70,000 resistance amid renewed bullish momentum, a cryptocurrency trading expert is warning investors to be cautious.
Specifically, the recent momentum that has seen Bitcoin sustain its valuation above the crucial $65,000 level has the hallmark of being a bull trap, signaling an inverted correction, Alan Santana noted in a TradingView post on October 16.
In the analysis, Santana compared Bitcoin’s growth from early August to the present, highlighting that the recent 39% rise is not a genuine bullish impulse but rather a deceptive rally.
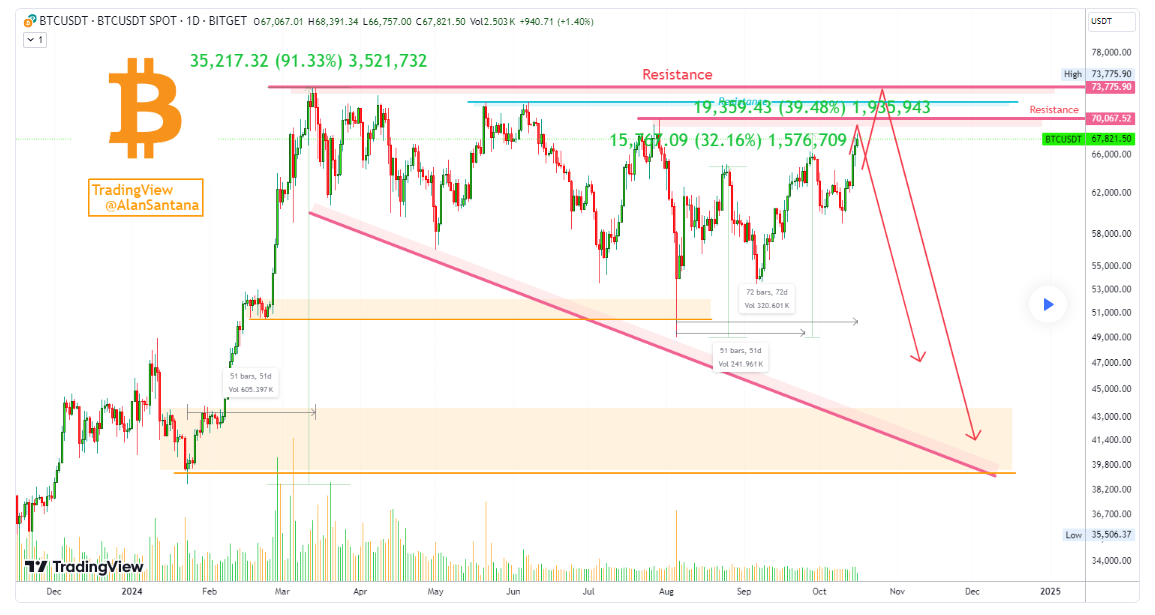
Unlike the bullish move in January 2024, where Bitcoin grew by 91% over 51 days with higher highs and higher lows, the current market structure presents lower highs and lower lows, which is a sign of weakness.
Santana cautioned that the market is in a precarious position, warning that Bitcoin could be headed for a significant drop, potentially revisiting price lows around $39,000 or even lower.
While many hope Bitcoin will hit the $100,000 mark, Santana’s analysis suggested otherwise, urging caution for traders in the coming weeks.
“This is not a bullish impulse. This is an inverted correction. Bitcoin is going down. It is a bull-trap,” he said.
Economist and Bitcoin critic Peter Schiff also supported this bearish outlook. In an X post on October 16, he noted that despite Bitcoin recording gains in the short term, the asset remains bound in a range below its all-time high, signaling a possible correction in the near future.
Bitcoin’s bullish case
However, an analysis shared by a crypto analyst who goes by the pseudonym The Moon suggested that Bitcoin has again retested its support level around $65,000, bouncing back strongly into a symmetrical triangle pattern.

In this case, Bitcoin is currently trading within the confines of this triangle, which often signals a period of consolidation before a breakout. Therefore, the analysis suggested that the next major target could be around the $70,000 mark.
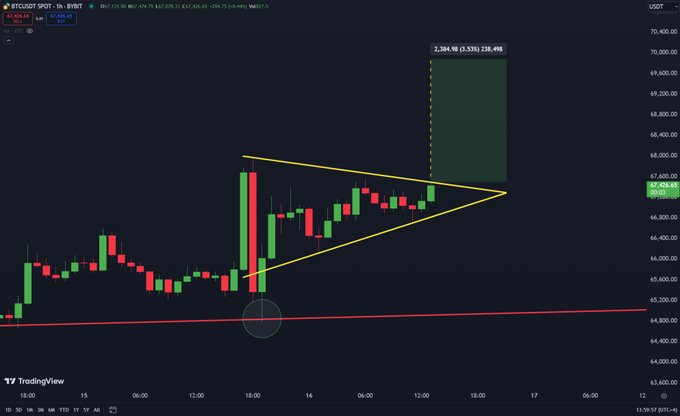
Notably, a symmetrical triangle pattern can break out in either direction, but if Bitcoin maintains its momentum and breaks upward, it could push higher.
On the other hand, some believe the current Bitcoin price movement could be the kickoff of the “Uptober” rally when the asset tends to trade at new highs in October. In this context, analysis by Trading Shot, citing technical indicators, indicates that the next possible target for Bitcoin could be around the $88,000 mark.
The analyst’s take comes after Bitcoin faced the threat of sustained losses below $60,000. Notably, the maiden cryptocurrency dropped below this spot last week in reaction to hotter-than-expected September inflation data.
Meanwhile, the long-term outlook for Bitcoin largely remains bullish. For instance, Standard Chartered analysts predicted that the asset could reach $150,000 by the end of the year, especially if Republican candidate Donald Trump clinches the White House. Indeed, Trump has expressed his support for Bitcoin, vowing to make the U.S. a leader in digital asset innovation.
Bitcoin price analysis
Bitcoin was valued at $67,807 by press time, having rallied by over 1.6% in the last 24 hours. On the weekly chart, BTC is up almost 10%.
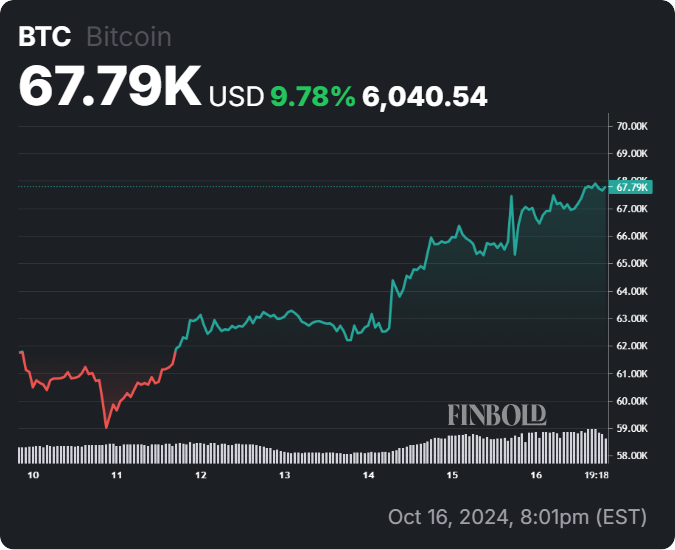
At the current price, Bitcoin is trading above its 50-day and 200-day simple moving averages, indicating strong upward momentum in both the short and long term. With an RSI of 65.99, it’s nearing overbought territory, suggesting a potential for a short-term pullback, though the overall trend remains bullish.