Gold is witnessing immense growth this week, posting a relative strength index (RSI) of 91.8 on Monday, October 13, the highest reading in history, surpassing even those seen during 2001, 2008, and 2020 rallies.
At the same time, the precious metal is up 55% on the yearly chart, having added over $10 trillion to its market cap over the past 12 months.
While the most “overbought” levels since 1979 would normally suggest a pullback, the most beloved hedge asset is actually up another 0.50% per ounce today, trading at around $4,132 per ounce at the time of writing.
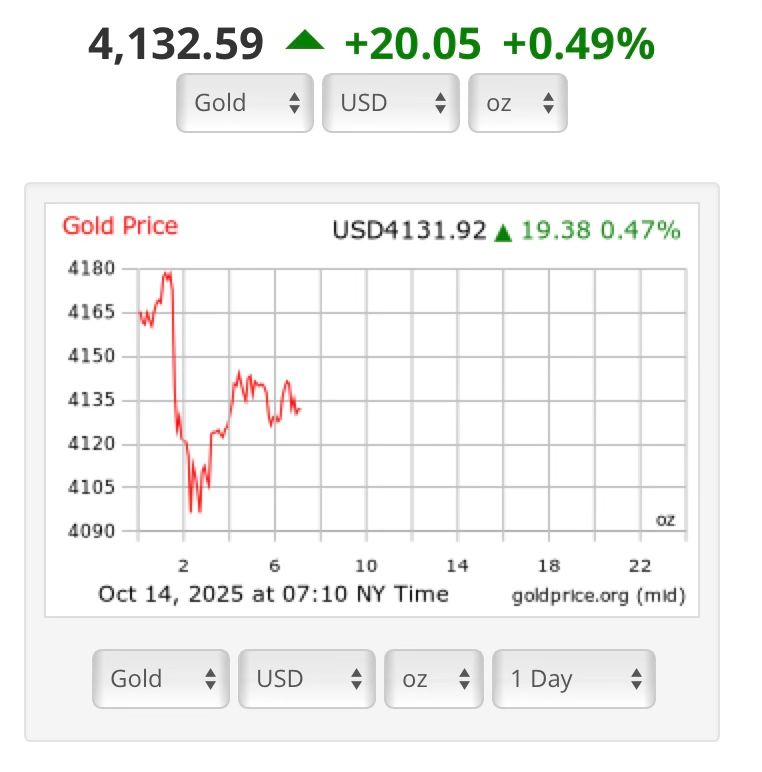
What is more striking is that the rally continues despite a stronger U.S. dollar. Indeed, the currency has rebounded some 2% over the past week and a half while the yellow metal is up more than 5%.
Central banks fuel the gold rally
Central banks have been fueling the upswing behind the scenes. In August, they added roughly 15 tons of gold to their reserves in what was the 27th consecutive monthly purchase.
China has been exceptionally prolific, its reserves climbing from 1% to 6.5% in the past decade, while U.S. Treasury holdings have dropped from 44% to 22%. In other words, it appears that as central banks diversify away from the dollar, gold’s share of global reserves is going up.
However, when adjusted for U.S. money supply, prices are still breaking out of a 50-year downtrend, suggesting that even at record nominal highs, the precious metal may still be early in its long-term cycle.
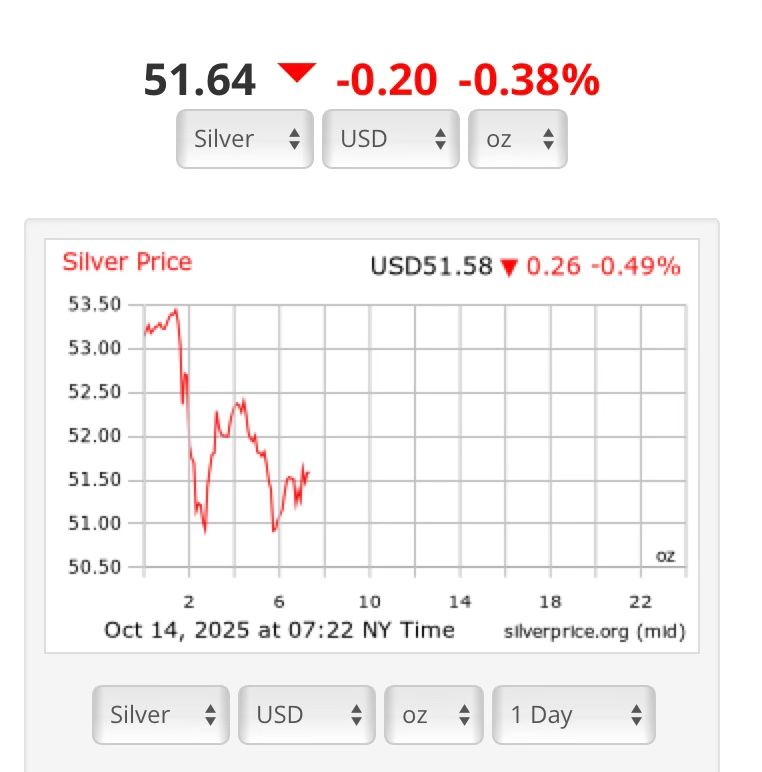
Meanwhile, silver is staging its own historic breakout, touching $53 per ounce in early trading today, although it has since dropped 0.38%, trading at $51.64 per ounce at press time.
Nonetheless, both assets are still outpacing the S&P 500 by more than fourfold, even during a strong equities bull market.
Featured image via Shutterstock