
Gold witnessed impressive price movements in September, with the precious metal rallying to new highs above $2,600, but technical indicators are pointing to a possible correction in the coming weeks.
For instance, forecasting platform Gold Predictors has highlighted one such bearish outlook. If gold continues its current momentum without a minor correction, it could lead to a sharper decline later, the analysis noted in an X post on October 7.
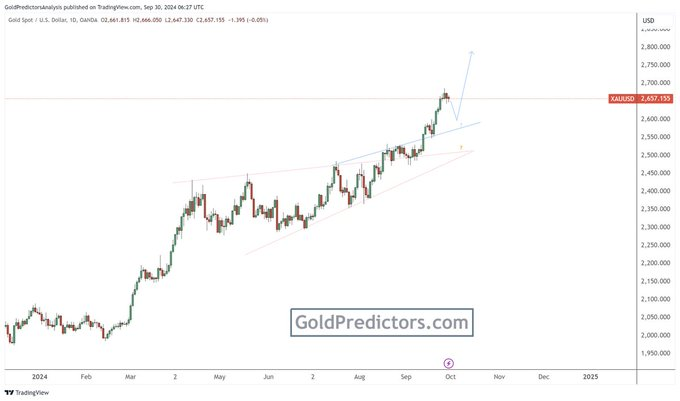
Since the beginning of 2024, Gold Predictors observed that the yellow metal has steadily climbed, with prices accelerating notably in September. However, based on recent chart patterns, a potential pullback scenario could see prices correcting in October or November.
After a sustained rally throughout the year, the analysis noted that gold has broken out of a consolidating wedge pattern, signaling further potential upside. However, there is the risk of a near-term pullback toward the $2,500 support level, followed by a likely continuation of the uptrend. To this end, the experts noted that if gold experiences minor corrections, it should be viewed as a typical healthy price movement.
Gold enters a critical juncture
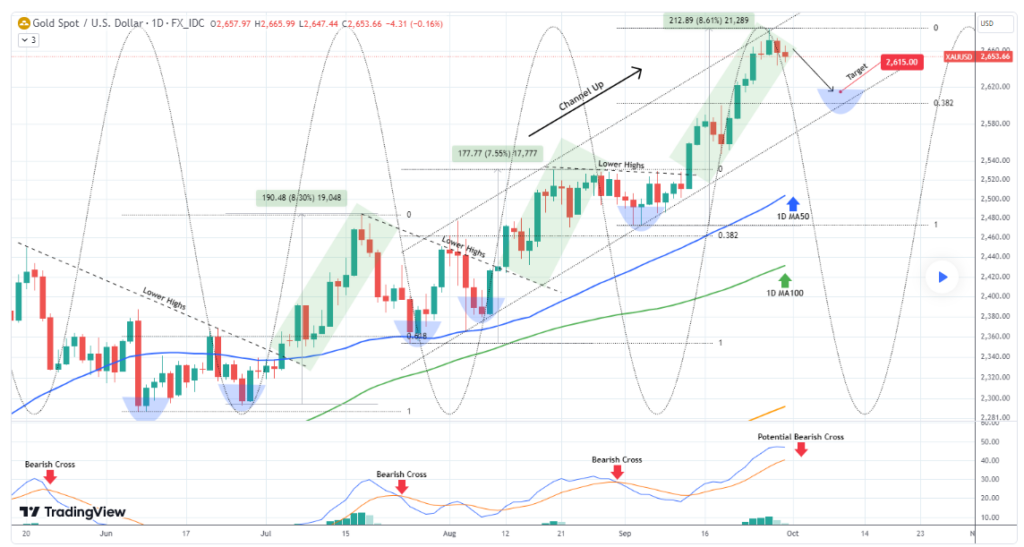
On the other hand, trading expert Alan Santana, in a TradingView post on September 30, noted that the precious metal is at a critical juncture, facing a potential short-term decline. Santana pointed out that gold has hit the upper boundary of a two-month upward trend but is exhibiting multiple signals of an impending pullback.
He stated that gold is not only at the peak of its channel but also nearing the top of its Sine Wave sequence. More concerning is the one-day Moving Average Convergence Divergence (MACD), which is approaching a bearish cross, a pattern that has been a reliable sell signal over the past four months.
Given these factors, Santana forecasts a short-term bearish outlook, with a target of $2,615. This level sits just above the 0.382 Fibonacci retracement, which has proven to be a significant support zone in recent months.
Impact of U.S. presidential elections on gold prices
In explaining gold’s September momentum, a trading expert with the pseudonym SmartReversals noted that the trajectory aligned with seasonal trends and could hint at what to expect next.
In an X post on September 30, the analyst stated that gold’s performance has closely followed historical patterns, especially during U.S. election years with Democratic presidencies. This analysis was highlighted using the Bank of America (NYSE: BAC) research data, which showed how gold tended to rally in September, particularly under Democratic leadership, before experiencing a correction.
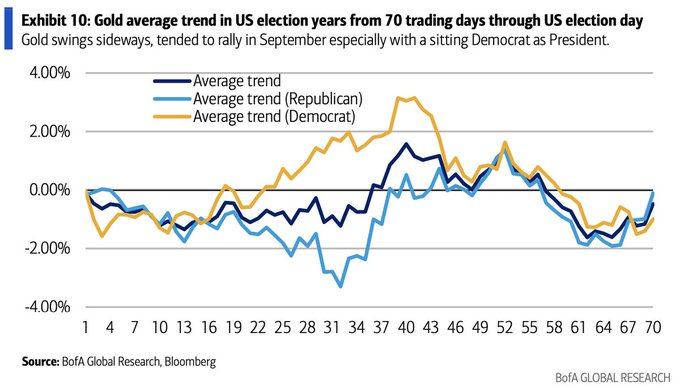
The analysis suggested that if this historical seasonality repeats itself, gold could soon face a deeper pullback, risking its trajectory toward the $3,000 per ounce level. Indeed, this comes at a period when there are concerns regarding Democratic candidate Kamala Harriss’ proposed corporate tax hike on the stock market, where some experts project a crash if she is elected in November.
It’s worth noting that gold has risen amid growing uncertainty about the United States economy and escalating geopolitical tensions in the Middle East. At the same time, the metal appeared to target the $3,000 mark after markets rallied in the wake of the Federal Reserve’s interest rate cuts.
Consequently, a section of investors, such as hedge funds, are showing optimism about the continued growth of the metal, with the $3,000 mark remaining an ideal target. In the meantime, there are concerns regarding the end of gold’s massive rally in 2024, with a section of the market warning that it could anchor a possible black swan event.
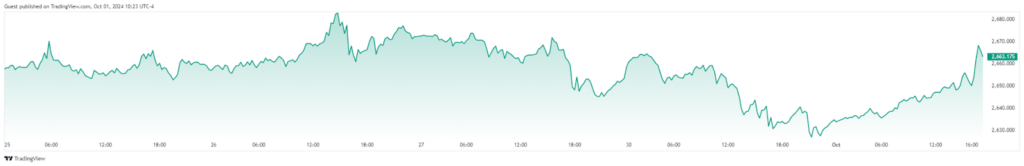
As of press time, gold was trading at $2,661, up over 1% in the last 24 hours. On the weekly chart, the metal is up 0.1%.
While gold’s recent rally has been impressive, technical indicators suggest a potential short-term correction. Therefore, investors need to focus on historical patterns, geopolitical factors, and economic uncertainty to determine how the metal’s price movement will shape up.