

XRP could be on track for a move toward $2 if a key technical pattern continues to develop on its daily chart.
According to an analysis shared by market analyst Ali Martinez in an X post on September 18, the cryptocurrency is forming the right shoulder of an inverse head-and-shoulders pattern, a setup widely viewed by traders as a bullish reversal signal.
The formation comes after XRP rebounded sharply from lows near $1 and is now consolidating around $1.40 as the market watches a critical resistance zone.
The analyst identified the neckline of the inverse head-and-shoulders pattern near $1.55. This level represents the key hurdle XRP must overcome to validate the bullish setup.
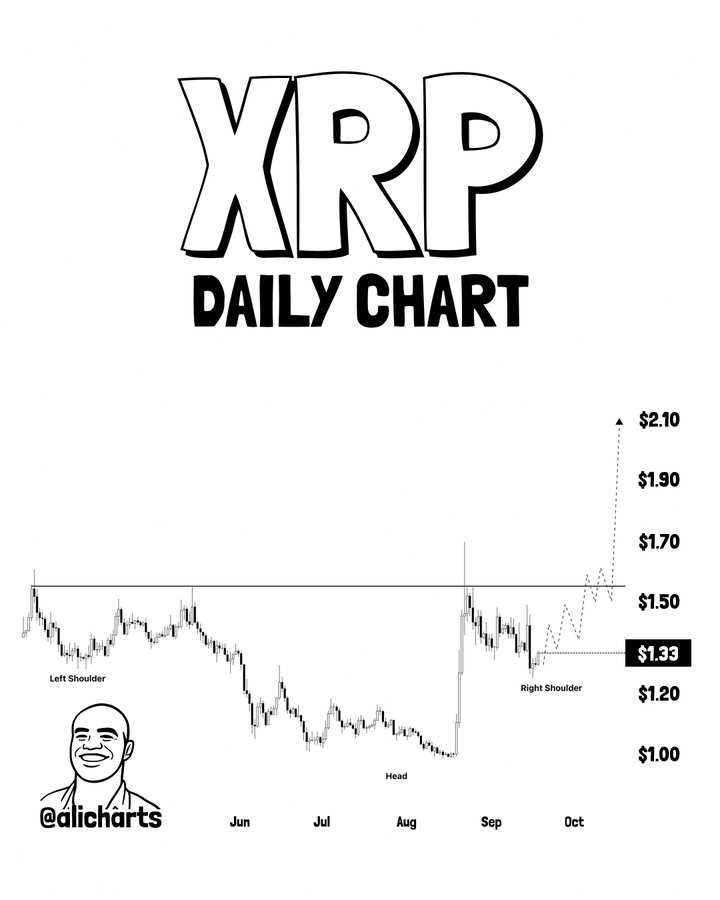
On the chart, the left shoulder formed during May, while the head developed around August when XRP briefly fell toward the $1 level. The current price structure suggests XRP is now building the right shoulder before attempting a breakout.
If buyers push XRP above $1.55 and the breakout is confirmed, the pattern projects a potential 35% rally from the neckline level. That move would place the token near the psychologically important $2 mark.
Notably, analysts use inverse head-and-shoulders formations to estimate future price targets by measuring the distance between the head and the neckline and projecting that range upward from the breakout point.
Based on the current setup, Martinez’s XRP price prediction suggests that a successful move above $1.55 could open the door for a rally toward $2, with the potential for additional gains if bullish momentum accelerates.
The technical setup is also being supported by improving market sentiment and continued institutional interest in XRP products.
XRP price analysis
At the time of reporting, XRP was trading around $1.41 while several market indicators remained constructive.
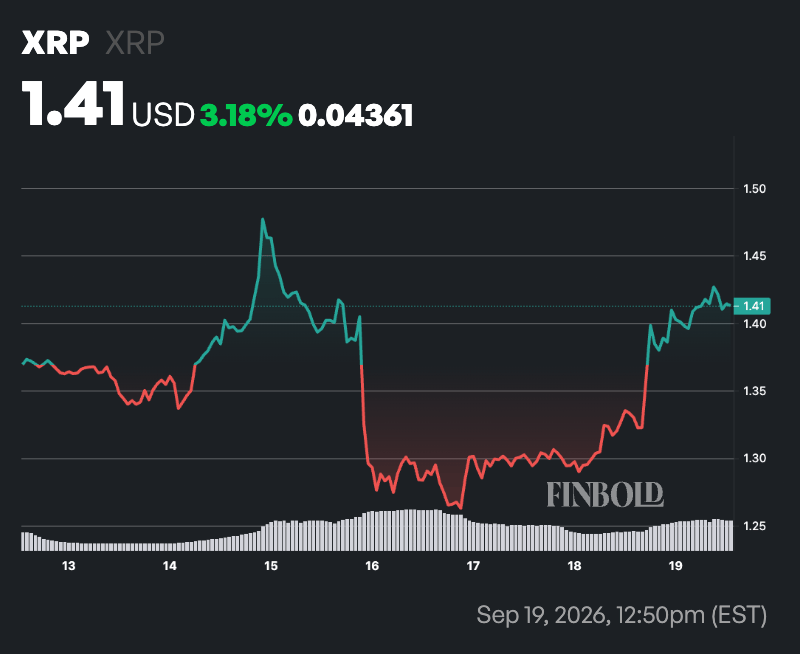
The asset’s Fear & Greed Index stood at 71, signaling strong investor optimism, while XRP trades above both its 50-day simple moving average (SMA) at $1.25 and 200-day SMA at $1.27. Meanwhile, the 14-day Relative Strength Index (RSI) was at 55.29, indicating neutral momentum with room for further upside before entering overbought territory.
At the same time, institutional flows have also remained relatively resilient despite recent volatility. Data from XRP spot exchange-traded funds (ETFs) showed net inflows of $11.26 million on September 14 and $3.5 million on September 16, highlighting continued investor demand for XRP exposure.
Although the market recorded net outflows of $5.15 million on September 17 and a modest $43,700 outflow on September 18, the earlier inflows suggest institutions continue to accumulate XRP despite short-term profit-taking activity.
ETF inflows generally support prices by creating additional demand for the underlying asset, while sustained outflows can weigh on momentum as investor capital exits the market.
In XRP’s case, the overall flow picture remains mixed but broadly constructive, complementing the bullish technical structure forming on the daily chart.
Featured image via Shutterstock