
Bitcoin’s (BTC) latest pullback is intensifying concerns that the asset’s rally may be approaching a critical turning point.
In this context, Mike McGlone, senior commodity strategist at Bloomberg Intelligence, believes Bitcoin’s recent price action below $70,000 signals a broader mean reversion after years of speculative excess.
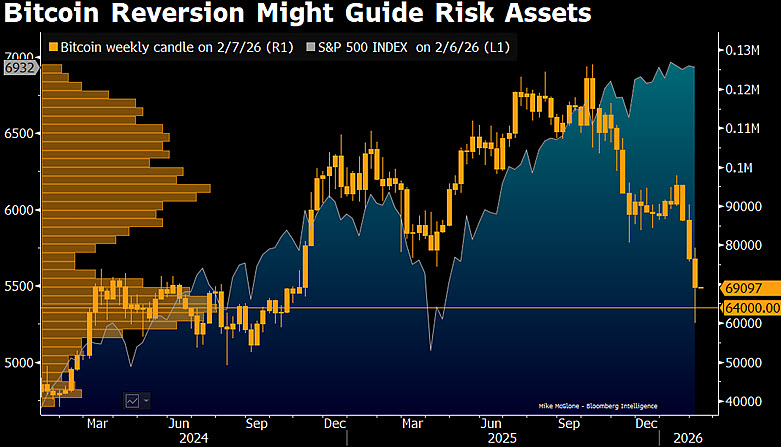
In an X post on February 7, McGlone stated that Bitcoin is a product of the post–global financial crisis environment, where abundant liquidity fueled a prolonged inflation in risk assets. As that cycle matures, Bitcoin appears to be gravitating back toward its historical mean and most frequently traded range, which aligns closely with the $64,000 level he highlighted.
He supported his assessment with a weekly Bitcoin chart showing repeated tests of the mid-$60,000 area, while volume data highlights heavy trading activity around $64,000. This indicates the level has acted as a structural support, absorbing selling pressure during recent pullbacks.
Bitcoin’s crash impact on stocks
The chart’s comparison with the S&P 500 highlights Bitcoin’s role as a leading indicator for broader risk sentiment. Historically, sustained Bitcoin weakness has coincided with or preceded equity market drawdowns. With stock indices still elevated, a failure to hold $64,000 could signal rising stress across risk assets.
“The graphic shows Bitcoin reverting to its mean and mode from the election year at about $64,000 — a potential line in the sand. If $64,000 is breached, dominoes can tumble, with the stock market potentially next,” he said.
McGlone cautioned that a decisive break below this level could accelerate downside momentum, prompting a wider reassessment of risk exposure and potentially spilling over into equities and other risk-sensitive markets.
Bitcoin price volatility
His outlook comes as Bitcoin rebounded modestly after a volatile week that saw the cryptocurrency briefly dip below $61,000, confirming a deepening bear phase. The flagship digital asset has fallen nearly 45% from its all-time high of approximately $126,000 in October 2025, erasing post-election gains and entering what analysts describe as a classic crypto-winter correction.
On February 5–6, BTC experienced its steepest single-day drop since late 2022, plunging 15% before surging 11% in a sharp rebound that briefly pushed prices back above $70,000.
Notably, the crash was triggered by several factors, including macroeconomic pressures such as tariff uncertainties, Federal Reserve policy doubts, and broader risk-asset volatility, alongside a reversal in institutional flows into U.S. Bitcoin ETFs, which have recorded net outflows in early 2026 after strong inflows previously.
At the same time, on-chain metrics show mixed signals: retail wallets are accumulating aggressively on dips, defending support near the $60,000–$63,000 range, while larger holders are distributing, capping upside momentum.
By press time, Bitcoin was changing hands at $69,464, up about 2% over the past 24 hours, while on the weekly timeframe, the cryptocurrency remains down roughly 11%.
Featured image via Shutterstock