
While President Donald Trump has maintained a pro-cryptocurrency stance, Bitcoin (BTC) buyers at the time of his inauguration are now in the red, despite the asset’s rally during his swearing-in.
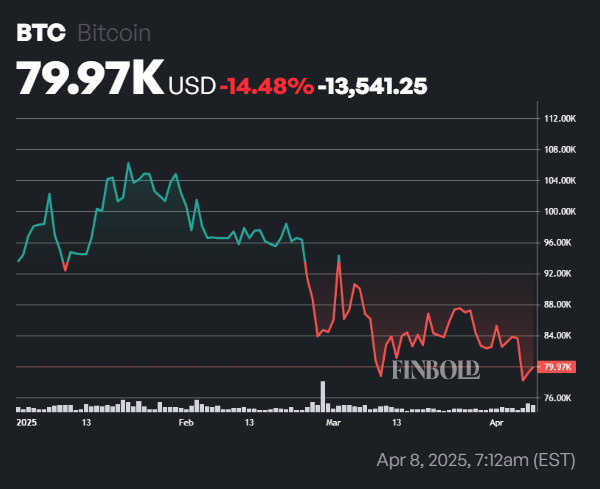
Notably, on January 20, 2025, at the start of Trump’s second term, BTC traded at the coveted six-figure value of $101,083.
However, as of press time on April 8, Bitcoin has plunged, reflecting broader market volatility partly stemming from trade tariff uncertainty.
The flagship asset has dropped to $79,676, marking a 21% decline since Inauguration Day.
To put this drop into perspective, if you had invested $1,000 in Bitcoin on January 20, you’d now have approximately $787, a $213 drop in value.
Indeed, Bitcoin has failed to make a decisive upward move despite Trump implementing some of his cryptocurrency-friendly policies, such as establishing a strategic Bitcoin reserve.
The investors appear unconvinced by the move, with its price mostly consolidating below the $90,000 mark. This stagnation can also be partly attributed to profit-taking and broader macroeconomic headwinds.
In the short term, Bitcoin has taken a sharp dip below the $80,000 level, triggered by prevailing economic uncertainty stemming from the Trump tariffs. The stock market was also hit with this unease, wiping out trillions in a single day on April 4.
What next for Bitcoin’s price
Bitcoin’s main focus now is to reclaim the $80,000 level to validate any bullish stance, while dropping below $70,000 could hint at the start of a bear market.
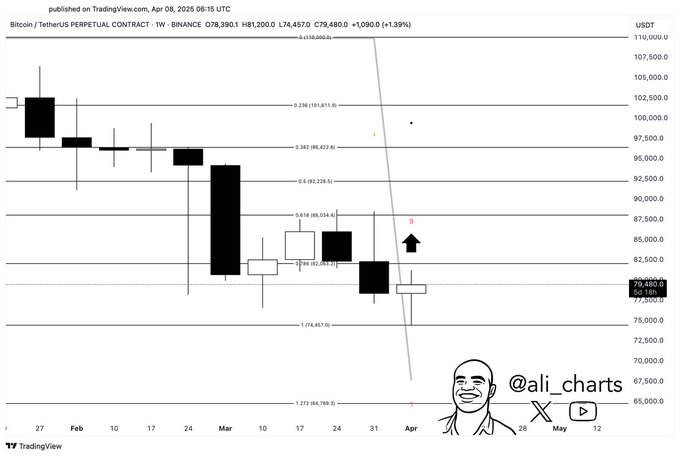
Looking forward, prominent cryptocurrency analyst Ali Martinez noted in an X post on April 8 that the maiden digital currency is showing a bullish TD Sequential buy signal on the weekly chart, suggesting a potential trend reversal.
The analyst emphasized that Bitcoin needs to hold above $74,500 and break past $82,000 to confirm the move. If successful, the next key target is $88,000. However, a drop below $74,500 could invalidate the setup.
Meanwhile, the general market sentiment remains bullish for the long term despite short-term price volatility. This sentiment is highlighted by the fact that institutional demand for the leading digital asset remains strong.
Featured image via Shutterstock