On August 6, 2024, Nvidia’s (NASDAQ: NVDA) closing price was just $98 — entering a long position at that time would have secured impressive returns for investors.
After a 10-1 stock split on June 7, 2024, aimed at making investing more accessible to retail investors, shares were trading at roughly $120.
June and July of 2024 were record months for the semiconductor company. NVDA stock prices reached two notable peaks — an all-time high of $135.58 on June 17, and $134 on July 24.
Picks for you
However, a ‘perfect storm’ occurred shortly after, significantly diminishing the share price of Nvidia without the company’s growth potential or future prospects fundamentally changing. In essence, what was seen was profit-taking on a mass scale.
NVDA stock price decreased due to a broad market selloff
To fully understand Nvidia’s August 6 low, investors need to take a closer look at key macro factors in the preceding days.
On August 5, 2024, many major indices recorded their worst day of trading in the last two years — with the Nasdaq composite shedding 3.4%, while the S&P 500 and DJIA closed at 3% and 2.6% less than the day before.
In addition, IT as a sector led the charge in the selloff — having shed 3.8% in value over the course of the day.
On top of that, the Bank of Japan had raised interest rates from -0.1% to 0.1% on August 2 — the highest level since 2008, which served to exacerbate fears while also effectively wiping out the viability of Yen carry trades. This move would contribute significantly to the overall selloff, as traders rushed to cover their sudden losses.
Moreover, all of this coincided with elevated fears in the media cycle about a potential AI bubble.
The profits from buying Nvidia’s dip
Putting it all together, NVDA’s stock price dipped 27.71% from the $135 all-time high to $98. However, it immediately started bouncing back — on August 18, just twelve days after the low, the share price had already climbed back to $130.
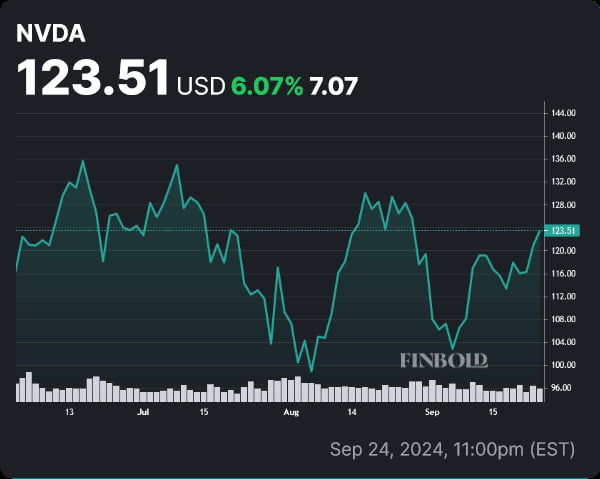
Investors who timed both the low and the subsequent high would have acquired shares at $98, and sold them at $130, for a profit of 32.65% — in other words, a tidy return of $326.5 on an initial investment of $1,000.
On the other hand, holding the stock at the time of writing, when the price is $123.51, would mean being up 26% — which would translate to a profit of $260 with the same amount invested.
NVDA is currently up 1.15% on the day and 5.94% on the weekly chart, amidst news that CEO Jensen Huang has sold the maximum amount of shares allowed. Once all is said and done, looking at long-term prospects, it would come as little surprise if our hypothetical trader would profit even more from holding the stock going forward.