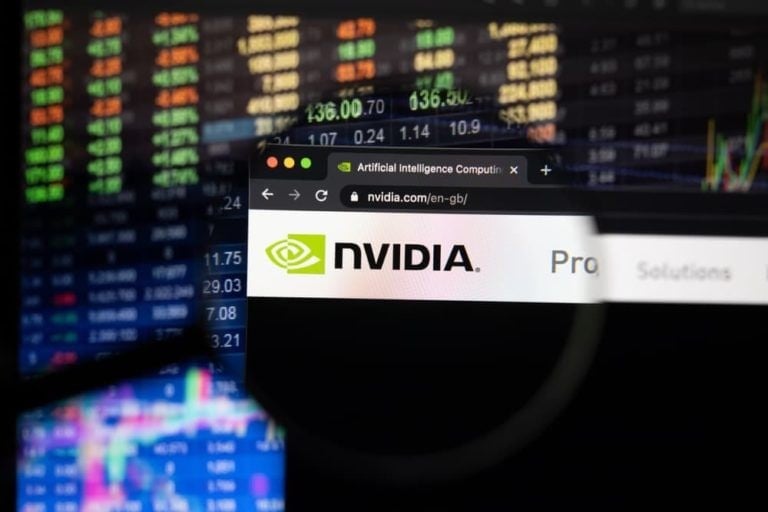
Nvidia Corp’s (NASDAQ: NVDA) CEO, Jensen Huang, executed a strategic financial maneuver on September 11, offloading 59,376 NVDA shares with a total value of $26,935,697.
This move marks the continuation of a notable divestment streak, with Mr. Huang having already liquidated an impressive $70 million worth of shares in just the past week.
The preceding week, on September 8, financial observers were alerted to the fact that Jensen Huang had embarked on a substantial share sell-off, parting ways with $42 million in Nvidia holdings. This development prompted speculation about the potential onset of a broader NVDA stock market correction.

NVDA chart analysis
It’s worth noting that despite a marginal dip from $462 on September 8, NVDA shares showed resilience by closing at $454.85, marking a 1.37% daily increase, and displaying a 0.14% gain over the past five days.
Delving into the technical analysis of Nvidia’s stock performance, we find that over the last month, NVDA shares have oscillated within a range spanning from $416.60 to $502.66, indicating a rather expansive territory. Presently, NVDA is positioned comfortably within the midpoint of this range, suggesting the presence of potential resistance overhead.
An intriguing support zone emerges, stretching from $449.55 to $453.03, forged through the convergence of various trend lines and significant moving averages across multiple time frames. Notably, there also appears to be minimal resistance looming above the current price.

Furthermore, NVDA presently resides in the upper echelons of its 52-week trading range, mirroring the broader trend of the S&P 500 Index, which is also situated in the upper tier of its annual trading spectrum.
Technically speaking, Nvidia exhibits strength as it hovers above key moving averages, including the SMA(20), SMA(50), SMA(100), and SMA(200). This confluence of supportive indicators augments the stock’s technical standing.
Adding nuance to the analysis, recent price action has showcased diminished volatility, coinciding with a period of consolidation. This consolidation phase suggests the potential for a forthcoming pullback, presenting an opportune entry point.
Buy stocks now with Interactive Brokers – the most advanced investment platform
Disclaimer: The content on this site should not be considered investment advice. Investing is speculative. When investing, your capital is at risk.