
Perhaps the best example of Jim Cramer’s fame, infamy, and influence is the ‘inverse Cramer’ strategy. The Mad Money host has an at times preternatural ability to recommend going long or short on an asset — only for the asset in question to experience a sudden move in the opposite direction.
While this is certainly humorous (and the subject of many memes and jokes), it was taken seriously enough by Tuttle Capital Management for it to create a real exchange-traded fund (ETF) based on the idea. The Inverse Cramer ETF (SJIM), however, only managed to accrue $2 million in assets under management (AUM) — and it ultimately closed in just 11 months.
Here’s the kicker, however — the M-word. Methodology. Tuttle’s approach was rather vague — members of the team had to constantly track Cramer’s commentary and then decide which of his picks to short. Jim Cramer makes stock picks on TV for a living — so the process was quite time-consuming.
Smartphone platform Autopilot, however, takes a different approach. Instead of focusing solely on shorts, their Inverse Cramer portfolio also goes long on stocks that Cramer dismisses.
Thus far, this has proven to be a much more lucrative way to leverage Cramer’s unique talent. Let’s take a closer look at exactly how the strategy has performed as of late.
The Inverse Cramer Strategy is performing admirably — but can it stay consistent?
From March 21, 2024, to March 21, 2025, the Inverse Cramer strategy secured a 31.8% return, per an update shared by the CramerTracker X account.
In contrast, during that same timeframe, the S&P 500 benchmark index marked a 8.28% increase. The Nasdaq composite provided a similar performance, with an 8.25% gain.
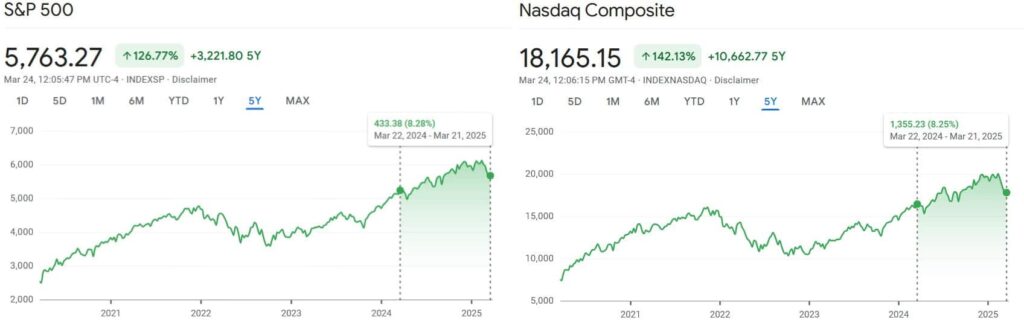
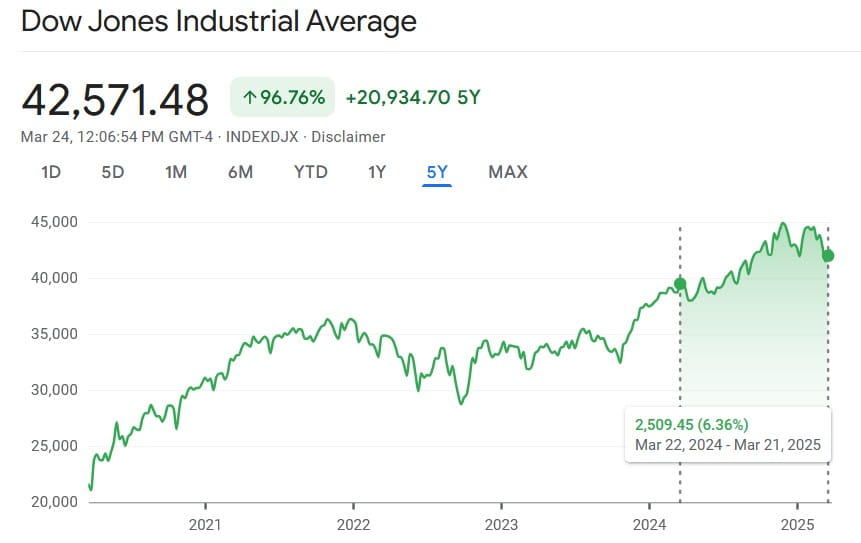
The Dow Jones Industrial Average (DJIA) marked an even more modest move to the upside in the aforementioned timeframe, at 6.36%.
So, what’s the secret behind the Inverse Cramer strategy? These indices and averages are broad measures that track the performance of wide swathes of the market and the U.S. economy. On the other hand, the Mad Money host, like most who work in financial media, tends to focus his coverage disproportionately on high-flying tech stocks.
In simple terms, the Inverse Cramer strategy, although it has provided superior returns, is much less diversified. While this is an advantage in a bull market, it remains an open question as to how the approach will fare in market downturns.
Featured image via Shutterstock