
The former hedge fund manager and current host of Mad Money, Jim Cramer, is no stranger to expressing shock with how investors are reacting to various news pertaining to Nvidia (NASDAQ: NVDA).
On Monday, March 17, he went even further and claimed that NVDA stock price was being ‘manipulated’ in the extended session.
Specifically, Cramer published a series of X posts claiming that Nvidia shares rallied in the Monday pre-market ‘on nothing’ and that they were intentionally ramped ahead of the GPU Technology Conference (GTC).
The former hedge fund manager also pointed out that, despite the notable rally in the extended session, NVDA stock began falling almost as soon as the morning bell rang.
Furthermore, the famous host expressed his belief that despite Nvidia being a multi-trillion dollar company, only millions were spent to ‘manipulate’ its price in the pre-market, concluding that nobody believes him when he says so, but that ‘it is true!!’
During the extended session, stock market volume – and, verily, the volume in most markets – is substantially lower than during regular trading, meaning that every individual trade has an oversized impact on price.
The strong change in direction once regular daily volume kicked in offers some indication that Cramer is right.
Nvidia stock collapses 22.27% from ATH within months
Elsewhere, whether manipulated or not, Nvidia has been struggling to maintain its positive momentum in 2025. After enjoying unprecedented growth for a company already among the biggest in the world, NVDA shares’ rise abruptly halted and reversed in January.
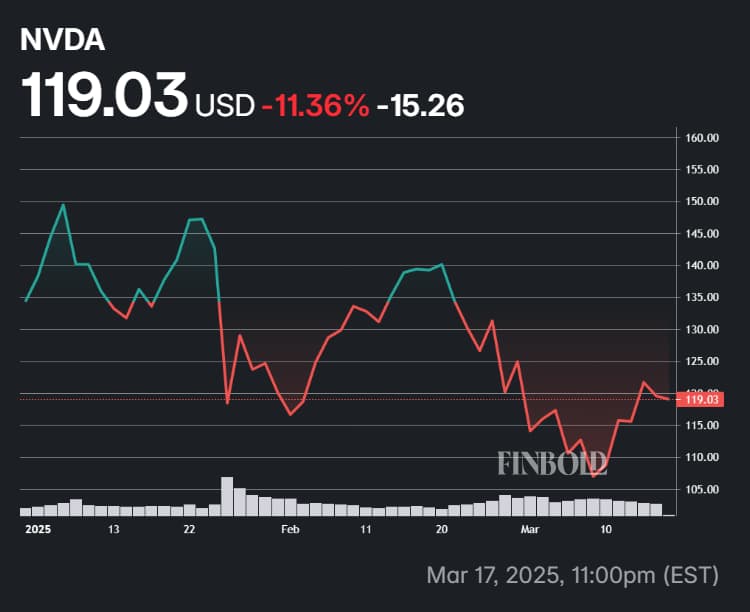
Nvidia stock is 11.36% in the red in the year-to-date (YTD) chart at its press time price of $119.03. Simultaneously, it is 22.27% below its all-time high (ATH) of $153.13, achieved on January 6, 2025.
The semiconductor giant’s decline can be linked to numerous factors, including increasingly stiff resistance from China, the escalating trade war, a wider loss of confidence in the U.S. economy, valuation concerns, and reported issues with the launches of the firm’s new products.
Featured image via Shutterstock