
Nvidia (NASDAQ: NVDA) shares are facing renewed downside pressure following revelations surrounding CEO Jensen Huang’s affair with a woman suspected of having links to Chinese intelligence.
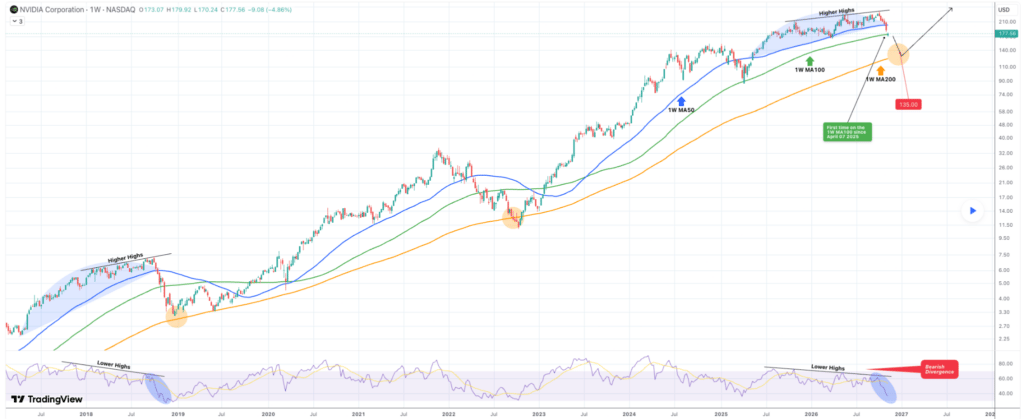
In an analysis published on November 9, TradingShot identified Nvidia’s weekly 100-period moving average (MA) as the key level determining whether its long-term bullish trend holds or extends into a deeper correction.
The warning follows two consecutive sessions of heavy losses that wiped approximately $430 billion off Nvidia’s market capitalization as investors reacted to the controversy.
Advertisement
NVDA shares closed at $168.89 on Tuesday, down 5.47%, extending Monday’s 4.27% decline and raising concerns about its leadership, corporate governance, and exposure to China.
Nvidia key price levels
According to TradingShot, Nvidia has reached its $175 medium-term price target, set on September 22. The latest decline also brought shares to their weekly MA100 for the first time since April 2025.
The analyst views the pullback as a technical correction following an extended multi-year rally rather than an immediate reversal of the long-term bullish trend.
The key now is whether Nvidia closes the week above the 1W MA100. The analyst noted that the stock also broke below this indicator in April 2025 but recovered before the weekly candle closed, allowing its uptrend to continue.
A similar outcome could support a recovery and help Nvidia reclaim its all-time high within the coming months.
However, a confirmed weekly close below the 1W MA100 would weaken the bullish outlook and expose the stock to a deeper correction toward its weekly 200-period moving average.
Advertisement
To this end, TradingShot identified $135-$130 as the next major downside target, noting that the 1W MA200 at $123 provided support during the September-October 2022 market bottom and the December 2018 correction.
The analyst also identified similarities between Nvidia’s current price action and its October-December 2018 correction.
Both periods followed strong multi-year rallies, with prices recording higher highs while the weekly Relative Strength Index (RSI) formed lower highs, signaling bearish divergence and weakening momentum.
TradingShot noted that the current RSI pattern resembles late October 2018, when Nvidia broke below its 1W MA100, potentially setting the stage for another extended correction.
However, the analyst does not view this as necessarily marking the end of the long-term bull cycle.
Instead, a decline toward the 1W MA200 could precede another rally.
Advertisement
Jensen Huang’s controversy
The controversy centers on Huang’s relationship with Alice Huang, a former Megaspeed International executive suspected of links to Chinese intelligence.
Huang acknowledged infidelity in a November 8 employee message, prompting Nvidia’s board to launch an independent investigation into reports of a foreign intelligence operation targeting him.
Separate allegations that Megaspeed helped smuggle Nvidia chips into China have drawn US lawmakers’ attention and triggered a shareholder lawsuit.
Nvidia denies evidence of compromised company secrets, but the investigation adds uncertainty around Huang’s leadership and the company’s China exposure.
Investors are also awaiting Nvidia’s November 17 earnings report for updates on AI chip demand and financial performance amid US-China restrictions.
Featured image via Shutterstock