
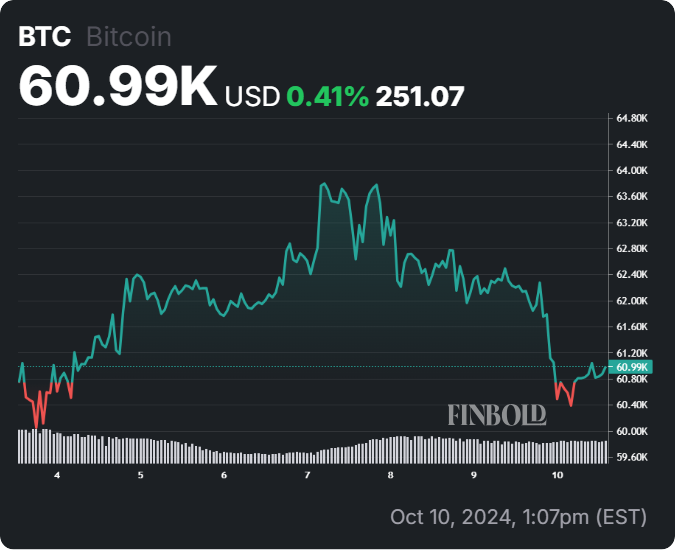
As Bitcoin struggles to maintain its valuation above $60,000, a market strategist has expressed his surprise regarding the asset’s inability to trade at a record high despite operating in a favorable environment.
According to the expert, Bitcoin’s price should be above $73,000, citing the current macroeconomic environment dominated by the recent Federal Reserve interest rate cut and geopolitical tensions; Roy Mattox, a chief market strategist, noted this in an X post on October 10.
In line with this observation, Bitcoin failed to hold its position above the $65,000 support, with the asset correcting in the wake of escalating tensions in the Middle East. This drop has cast doubt on Bitcoin’s ability to emulate gold and serve as a hedge in such an environment.
“I am a bit perplexed that Bitcoin is not at all time highs at this moment, considering the Macro backdrop. <…> With that said, then it’s all about position size, cushion, and patience,” Mattox said.
However, Mattox remains bullish, predicting that the ‘Bitcoin party’ will commence once the cryptocurrency surpasses the $73,000 mark, setting the stage for higher price levels in the first quarter of 2025.
“Bitcoin party begins over $73,000. Our targets are unambiguously much higher in first quarter of 2025. At an all-time high in price, the real move begins,” he added.
Bitcoin price levels to watch
In his analysis, Mattox laid a roadmap for traders looking to capitalize on Bitcoin’s next leg up. He highlighted several actionable price levels, including $63,600, $66,547, $70,027, $71,430, and finally $73,118, where traders could begin adding to their positions as BTC approaches its record high.
What’s more, the analyst also expressed long-term optimism, hinting that BTC could deliver substantial gains over the next five years.
As things stand, Bitcoin investors’ focus is on how the asset interacts with the $60,000 level. There is a general feeling that plunging below this mark increases the likelihood of sustained losses.
To this end, Bitcoin’s technical setup supports further correction, as crypto analyst Ali Martinez observed that the digital asset is stuck in a descending parallel channel.
In an October 10 analysis, Martinez noted that after Bitcoin suffered rejection at the channel’s upper boundary, the cryptocurrency faces a potential drop toward the middle boundary at $58,000, with a further decline to $52,000 not out of the question.

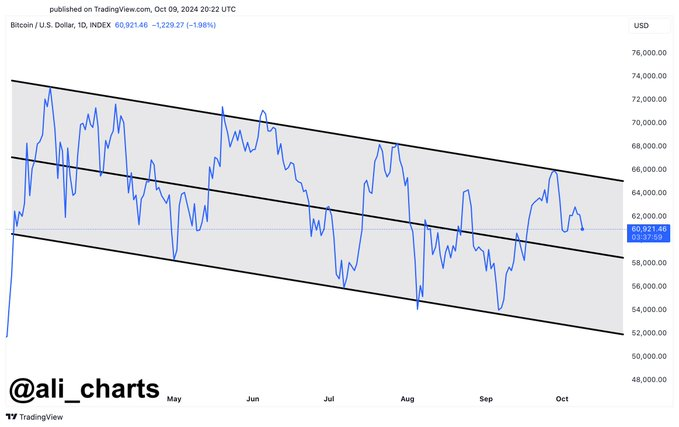
The bearish trend has kept upward momentum in check, and the analyst suggested that Bitcoin won’t see a bullish breakout until it convincingly clears the $66,000 level.
A similar outlook was shared by another analyst, RLinda, who noted that Bitcoin’s descending parallel channel signals a possible drop to $50,000.
What next for Bitcoin
Indeed, Bitcoin currently lacks decisive bullish sentiment, with downward pressure likely to be sustained amid fears of a possible market dump by the United States government.
Specifically, the government could sell the $4.33 billion seized from the Silk Road marketplace after the Supreme Court gave the green light for the possible sale of 69,370 Bitcoin.
For those looking for a bullish sentiment, the upcoming United States presidential polls could offer solace, considering that Republican candidate Donald Trump has expressed support for the crypto space. In this regard, analysis indicates that Bitcoin’s price is correlating with the odds of a possible Trump win.
Bitcoin price analysis
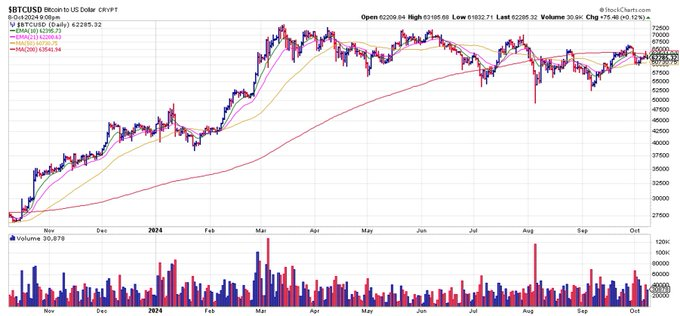
By press time, Bitcoin was trading at $60,990, having plunged 1.5% in the last 24 hours. On the weekly chart, BTC is up less than 0.5%.
Based on the current price movement, Bitcoin is finding support at the 50-day simple moving average (SMA) at $60,818, suggesting some short-term strength, but the real test lies ahead. At the same time, the asset’s short-term resistance sits at the 200-day SMA at $61,744.
Meanwhile, the 14-day Relative Strength Index (RSI) is at 45.49, signaling a neutral market sentiment. This indicates that, depending on price action in the coming days, there is room for either upward or downward movement.