
On-chain data is suggesting that Bitcoin (BTC) is likely to see more losses ahead before the asset finds a bottom.
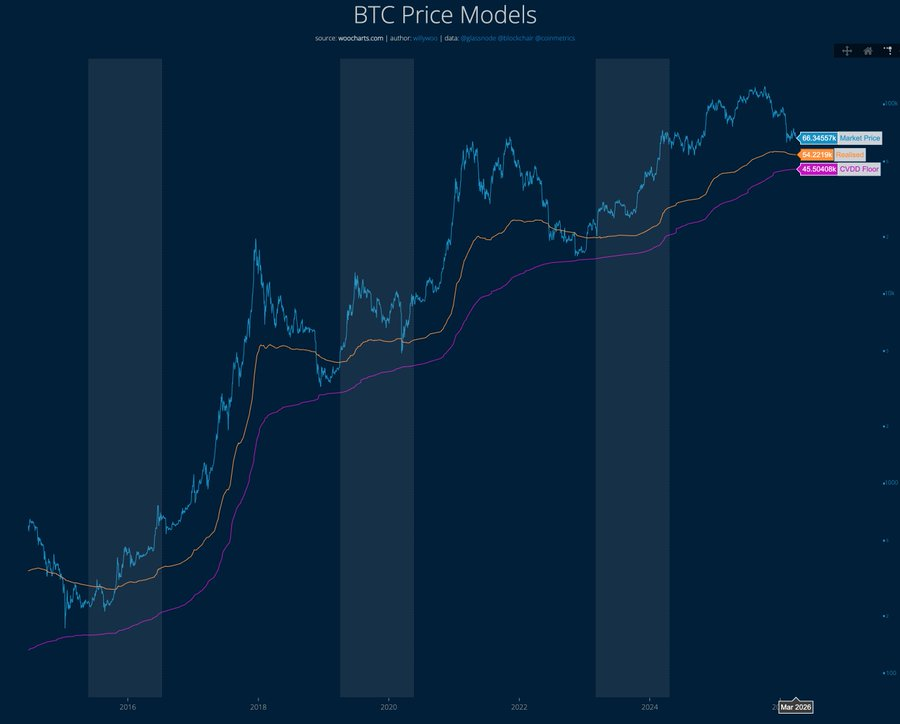
This outlook was shared by crypto analyst Willy Woo in an X post on March 30, where he noted that traditional on-chain valuation frameworks place Bitcoin’s likely bottom range between $46,000 and $54,000.
Central to this view is the CVDD Floor Model, which currently sits near $45,500 and continues to trend upward over time, reflecting the asset’s long-term accumulation dynamics.
The analysis shows Bitcoin has traded above both the realized price and the CVDD floor for most of the cycle, but is now compressing toward these lower bands. This convergence typically signals weakening structure.
Another signal is the decline in capital stored in Bitcoin, which has trended downward since November, indicating steady outflows. This aligns with softer price momentum and points to weakening investor conviction.
However, the model is based on just four prior bear cycles, all within a broader risk-on environment. If current conditions differ, downside risks could be greater, with a deeper and less predictable downturn possible.
More downside risk for Bitcoin
A similar downside outlook was also shared by another analyst, Ali Martinez, in an X post on March 29.
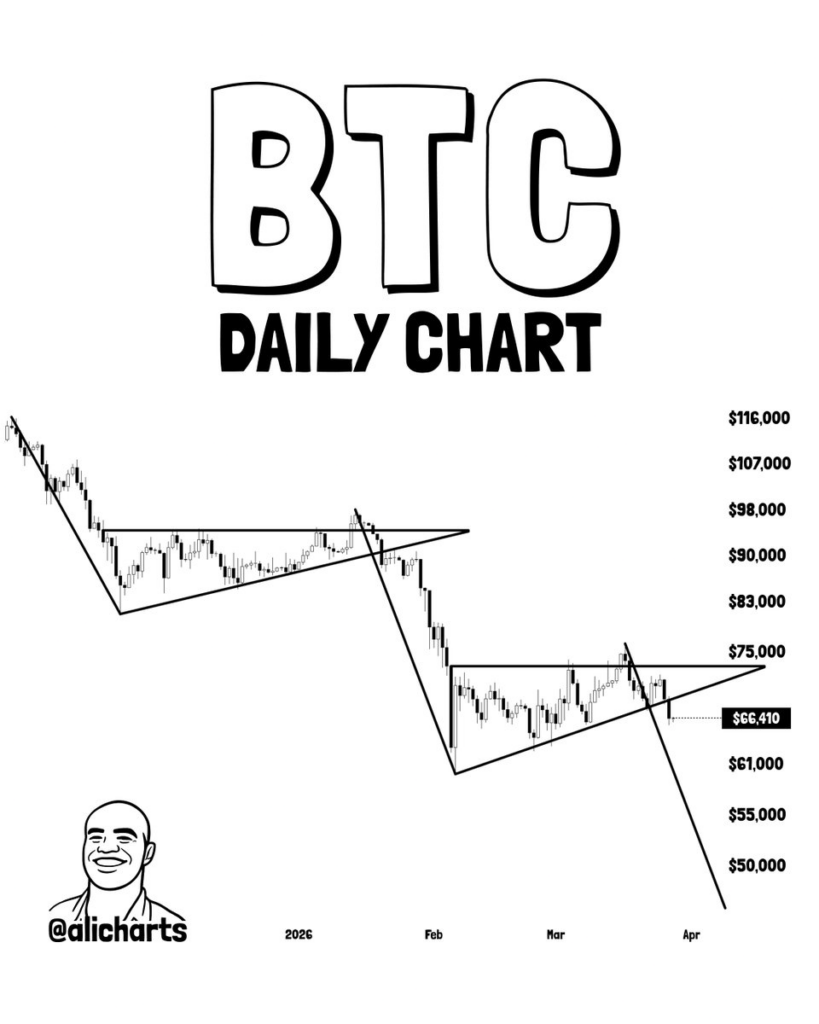
His analysis of the daily chart highlighted a recurring structure where Bitcoin consolidates within a rising wedge, followed by a breakdown and steep decline.
In the first instance, Bitcoin dropped from the mid-$90,000 range toward the low-$60,000s after losing support. A similar formation has now developed again, with price recently rejecting near the $75,000 resistance zone.
Currently trading around $67,000, the cryptocurrency appears to be breaking below the wedge structure once more. If the pattern plays out as before, the outlook implies a potential continuation lower, with downside targets extending toward the $50,000 region.
The repeated failure to reclaim higher resistance levels and the formation of lower highs reinforce weakening bullish momentum.
Bitcoin price analysis
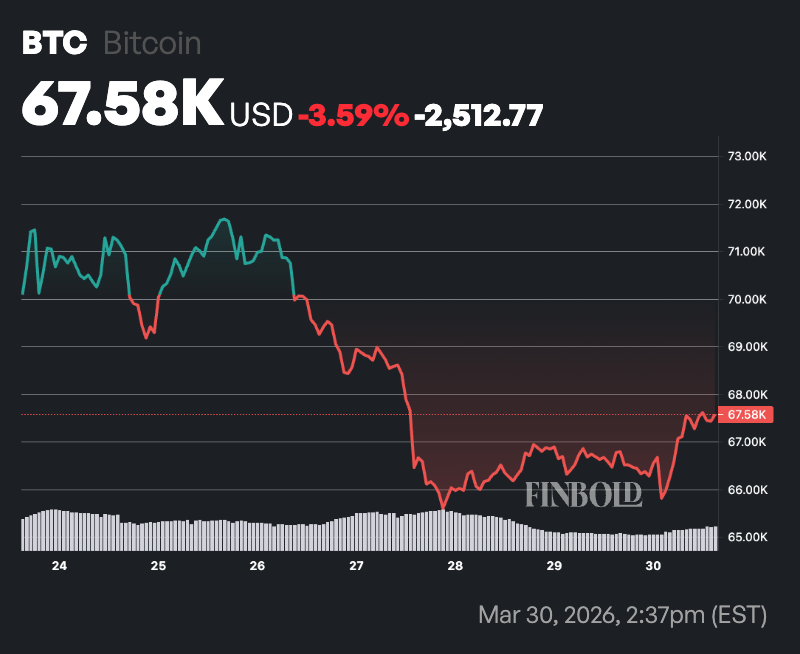
By press time, Bitcoin was trading at $67,567, up about 1.1% in the past 24 hours. On the weekly timeframe, BTC is down roughly 3.5%.
At the current price, the cryptocurrency is trading below its 50-day simple moving average (SMA) of $69,286 and well under the 200-day SMA at $91,404. This positioning reflects a weak technical structure, where short-term momentum has already turned negative, and the broader trend remains under pressure.
Meanwhile, the 14-day RSI at 40.32 reinforces this view. While not yet in oversold territory, it leans toward the lower end of the neutral range, indicating fading buying strength and a market that is struggling to build upward momentum.