The advent of artificial intelligence has the potential to transform entire industries and unlock new frontiers of efficiency — and financial markets have put a lot of stock (pun intended) in this possibility.
The current two-year bull run has been sustained in large part due to AI hype — and semiconductor stocks are leading the charge, having absorbed a lion’s share of the gains. This is most apparent with market darling Nvidia (NASDAQ: NVDA).
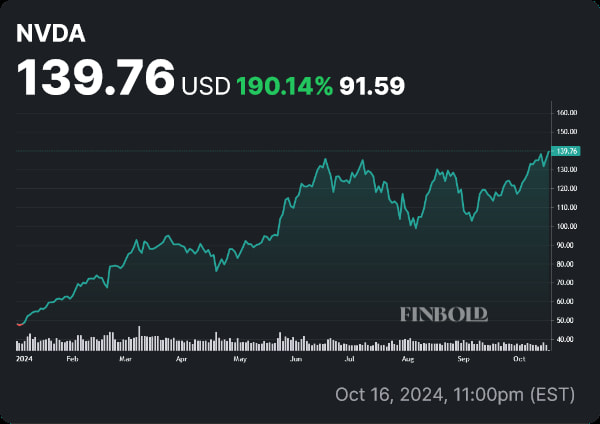
At press time, NVDA’s share price is $139.76 — having rallied by 190.14% over the course of 2024. A large part of that surge — 75.77%, to be exact, came in the last six months, and NVDA is now in contention to be the first one to reach a $4 trillion market cap.
Picks for you
Impressive as this is, it has left some segments of the market spooked — this isn’t the first time we’ve seen a rapid rise of new technological solutions coupled with high valuations.
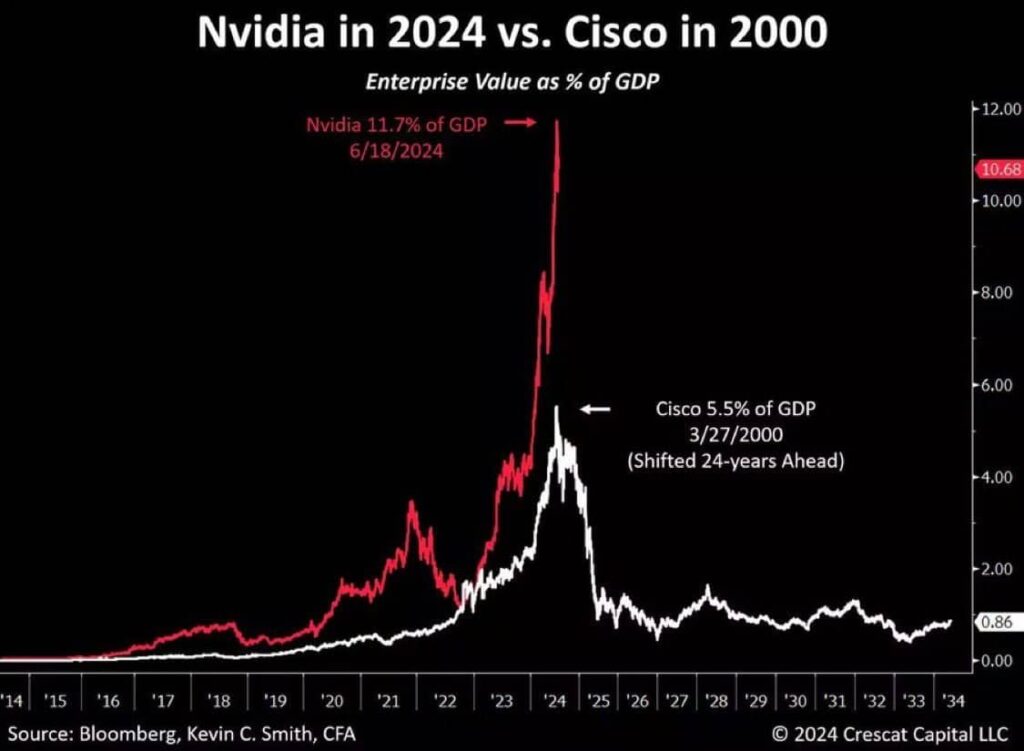
A chart shared by The Kobeissi Letter in an X thread, and originally made by Kevin C. Smith, CFA, draws a troubling parallel between NVDA today and Cisco (NASDAQ: CSCO) in 2000.
At its height, Cisco’s market cap was worth 5.5% of the U.S. GDP at the time. At press time, Nvidia’s market cap represents 11.7% of the nation’s current GDP, more than twice Cisco’s peak relative to GDP.
NVDA stock price volatility amidst bubble fears
Fears of a wider AI bubble have been present for some time — and Nvidia in particular has been singled out — partly on account of its being a leader, partly on account of inconsistent trading volume and rising short interest.
Such factors tend to increase caution — and the recent leak of ASML’s disappointing earnings report did little to help, driving down NVDA share price by 5% in the span of a single day. Some analysts, like Gene Munster of Deepwater Asset Management, deemed this to be a weakness confined to ASML and not directly tied to AI — one that does not reflect weakness in the sector.
Munster seems to have been right, as those losses were quickly reversed following TSMC’s positive Q3 2024 earnings report. The opinion was echoed by Wedbush’s Dan Ives, who deemed ASML ‘background noise’, and Jim Cramer, who highlighted the fact that TSMC’s earnings call stated that ‘Our customer’s demand far exceeds our ability to supply’ — pointing to NVDA as a crucial TSMC customer.
While the dust has settled — for now, at least, it’s clear that significant fears remain, as NVDA stock prices react intensely to news coverage like this.
Parallels between CSCO and NVDA
Returning to Smith’s chart, one might suspect that a correction is imminent and that the whole AI market will go down in flames any minute now.
That’s not quite likely, however — key differences exist between the two situations.
For one, in 2000, Cisco was in a less competitive but saturated market — preventing it from justifying the huge premium investors were paying for the stock in terms of forward earnings.
Nvidia might have the largest share in the markets it operates, but they are increasingly competitive markets, particularly with AMD’s (NASDAQ: AMD) new chips being released. To boot, growth is driven by demand from fields that are themselves expanding — self-driving vehicles, data centers, and cloud computing.
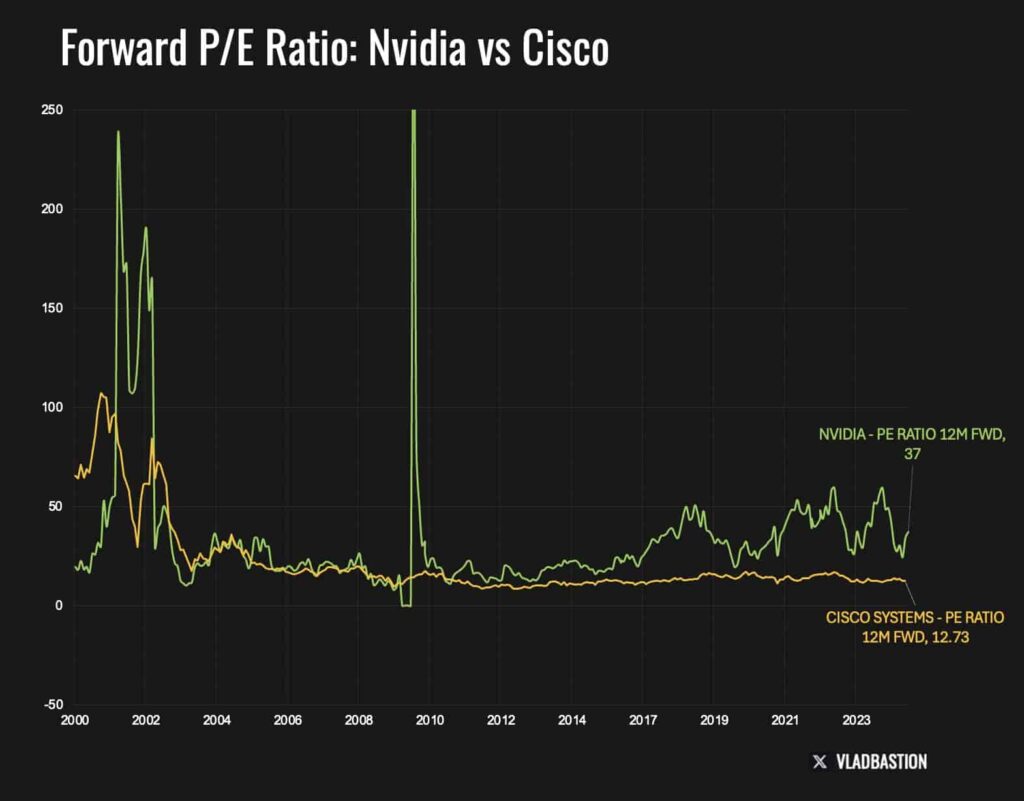
And speaking of forward earnings, we come to the greatest difference. A chart shared by Vlad Bastion, CFA, shows a significant discrepancy in terms of this metric. In 2000, Cisco’s forward P/E ratio was 105 — at press time, Nvidia’s forward P/E ratio is 37.
High valuations remain a concern — and we might very well be due for a correction. The Buffett Indicator, a broad measure of how overvalued the stock market is, currently holds steady at historically high levels — reaching 197% in early October.
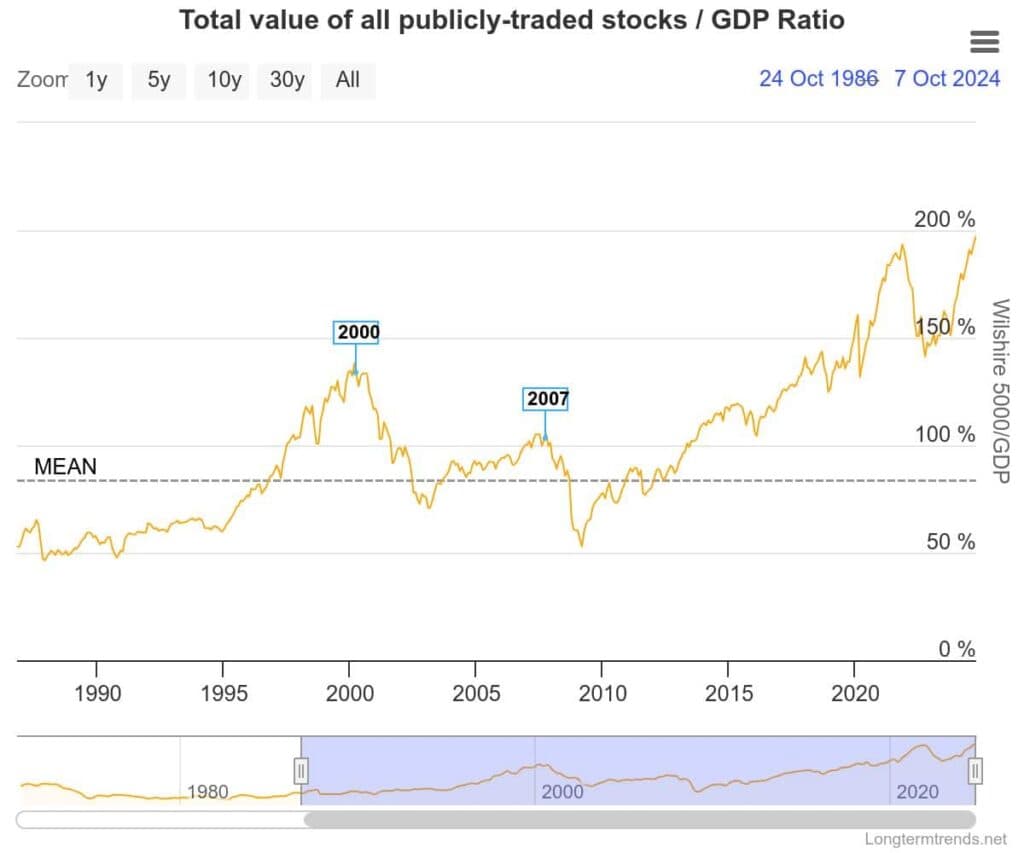
The indicator is a ratio comparing the valuation of the stock market with the GDP of the United States. This is also higher than what the indicator was showing at the time of the dotcom crash, which was 140%.
However, one of the main arguments used when discussing why Buffett’s indicator isn’t as reliable as it was in 2000 holds true here — in 2024, a much larger portion of the revenue accrued by leading companies isn’t from domestic sources. As such, using the GDP of the United States gives a much less representative evaluation.
Once all is said and done, if (or when) they are to be undone, these high valuations will suffer a correction caused by macroeconomic factors and changes in demand — while interesting, the findings presented here are not indicative of an imminent crash.