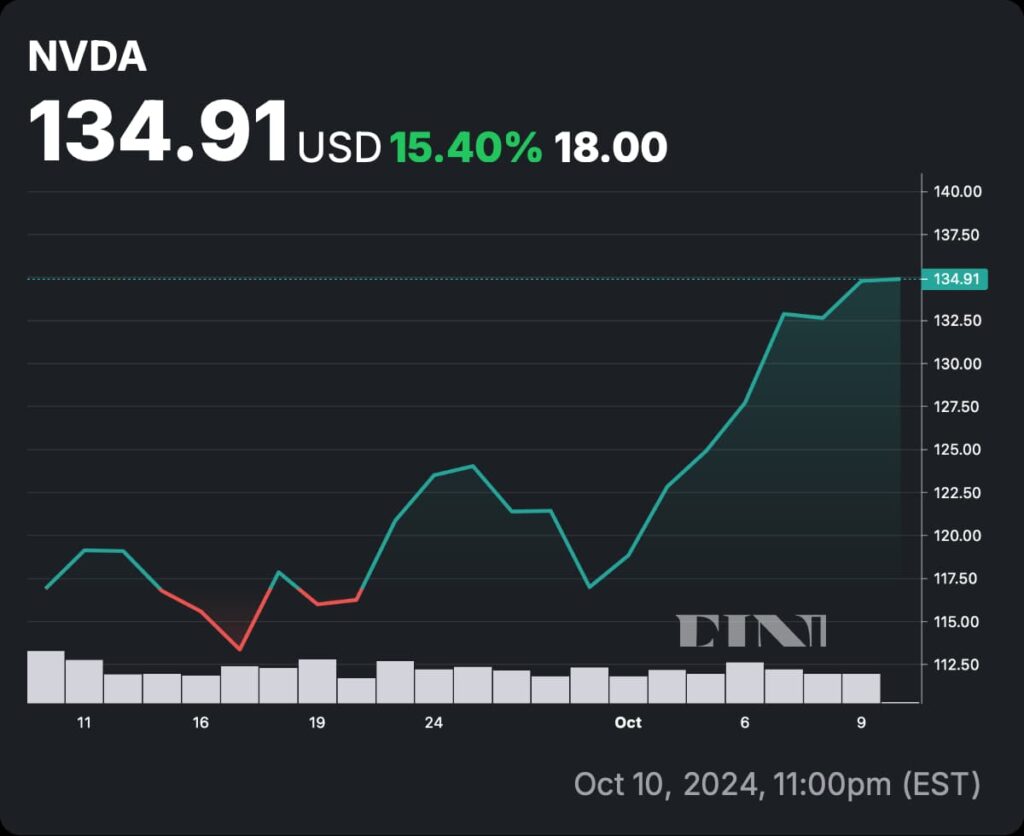
Nvidia (NASDAQ: NVDA) is making headlines once again, closing October 10 at $134.81, up 1.63% for the day, and trading near its 52-week high. But despite the apparent momentum, some analysts are raising red flags about the nature of the recent activity.
Michael Kramer, founder of Mott Capital Management and stock market analyst, has called out Nvidia’s trading behavior, describing it as “casino-like.”
Kramer’s concerns stem from the nature of trading volumes. While Nvidia has been trending upward, actual stock volume on October 10 was down nearly 15% compared to its 20-day average.
Picks for you
Instead, short-dated options, especially weekly calls, have dominated the trading landscape.
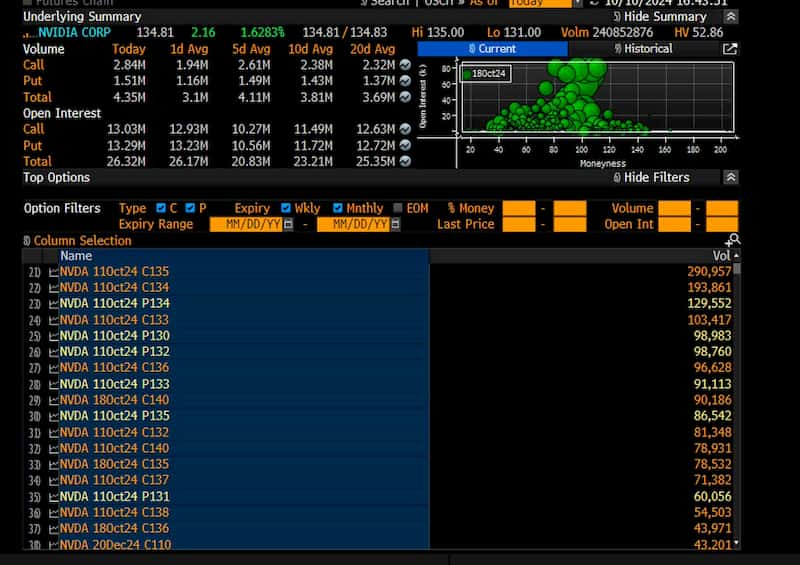
This kind of speculative frenzy has led Kramer to question the quality of the recent rally, noting that much of the activity seems disconnected from the company’s fundamental outlook.
High stakes NVDA trading: Is it all just a gamble?
The rise in short-selling is another point of concern.
On October 10, short-sale volume climbed to 82.9 million shares—nearly a third of the total shares traded that day.
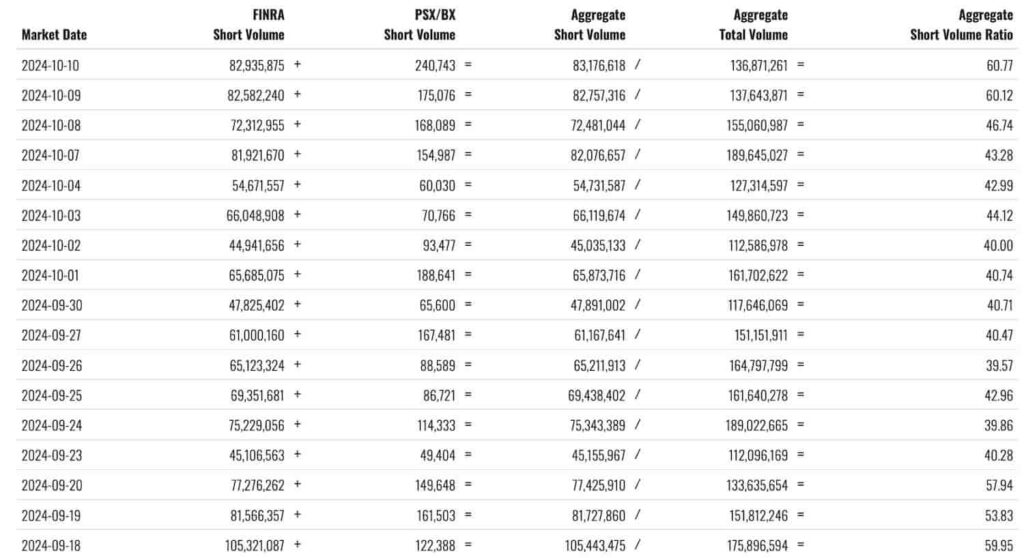
This uptick in short interest suggests that more investors are betting on a potential pullback.
Despite all the buzz, Kramer remains skeptical of the hype, noting, “At least on the surface, the stock appears to be a gambler’s haven, and this has probably less to do with the actual outlook of the business since most of the options are in weekly contracts.”
The investment expert highlighted the heavy focus on short-term options indicates that traders are treating Nvidia like a high-stakes bet rather than a long-term investment.
Moreover, the lack of significant changes in analysts’ revenue estimates for the company despite recent price movements further supports this view. The fundamentals haven’t shifted in weeks, yet Nvidia stock continues to draw massive attention, especially from retail traders and speculators.
Nvidia stock chart analysis
Nvidia’s current position near its recent highs comes as the S&P 500 also approaches new peaks, indicating that broader market sentiment may be influencing the stock’s direction. However, NVDA has played an outsized role in driving market gains, accounting for nearly 24% of the Bloomberg 500’s returns in 2024—a key ‘proxy for the S&P 500,’ Kramer noted.
NVDA shares have traded in a wide range of $113.22 to $135.00 over the last month, with key support levels identified between $121.90 and $122.83, meanwhile there is a resistance zone between $134.82 and $135.59.
For now, Nvidia is performing in line with the market, but the presence of increased speculative activity could make the stock more vulnerable to sudden reversals.
With most of the recent trading action driven by options rather than long-term buying, Nvidia’s rally may carry more risk than meets the eye. The stock’s alignment with broader market trends and the rising short interest suggest a fragile balance, where even a small shift in sentiment could lead to sharp moves.
For now, Nvidia’s performance remains a talking point, whether the stock’s rise is driven by genuine optimism or a speculative “casino-like” atmosphere remains to be seen, but with trading volumes skewing heavily towards short-dated options, the stakes have never been higher.
As Nvidia hovers near its resistance, investors should be prepared for a potentially bumpy ride ahead despite analysts’ bullish price targets.