Shares of Nvidia (NASDAQ: NVDA) are approaching a critical technical level that could determine the stock’s next major move, with an analyst projecting a decline toward $115 if key support fails.
According to TradingShot’s outlook, Nvidia has tested its 200-week moving average twice this week, the first revisit of the long-term support level in roughly ten months.
The latest touch comes shortly after an earlier test around March 2, when the level briefly held as support.
In a TradingView post on March 14, the analyst said the double test marks a critical moment for the stock, signalling renewed selling pressure and could confirm the start of a broader bearish phase. A similar breakdown during Nvidia’s January–March 2025 correction accelerated the stock’s decline.
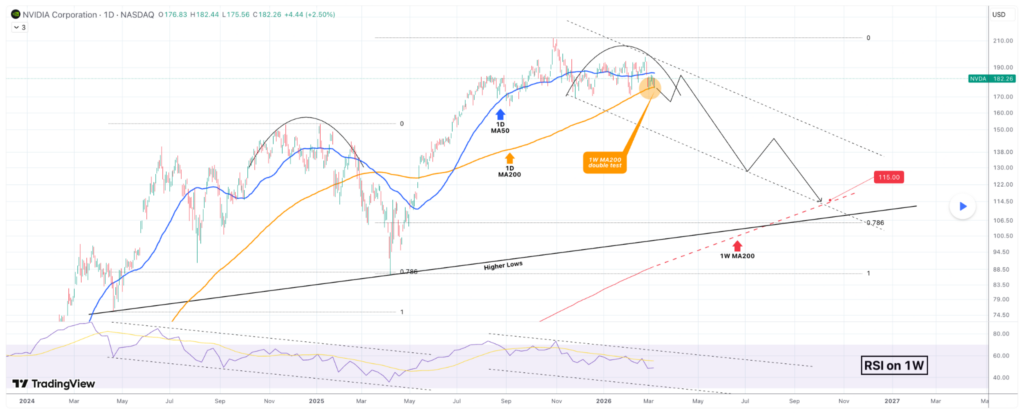
The outlook also suggested the semiconductor giant may be forming an arc-top pattern, a rounding formation often seen near market peaks.
Momentum indicators support the comparison, with the weekly RSI tracing a pattern similar to the one that preceded the 2025 downturn.
A long-standing higher-lows trendline has supported Nvidia’s uptrend for two years and is now converging with the 200-week MA, creating a potential long-term support zone if a deeper 2026 correction unfolds.
Historical retracement levels also suggest downside risk. In this case, NVDA’s 2025 correction bottomed at the 0.786 Fibonacci retracement from the prior major low, a level closely watched during major pullbacks.

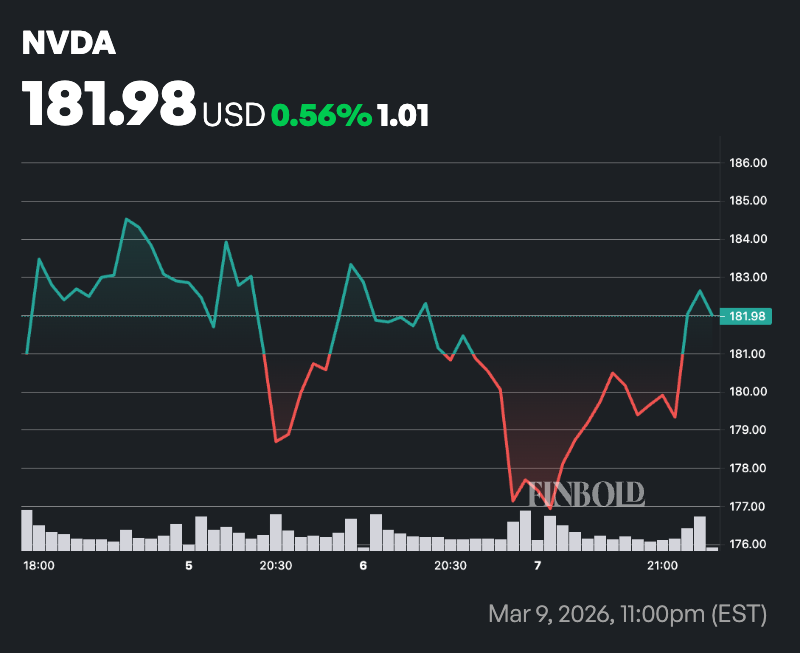
NVDA stock price levels to watch
A similar move could push the stock toward about $105 around August, though a slower decline toward the weekly 200 moving average later in the year appears more likely.
Under that scenario, Nvidia could fall to around $115 by the end of 2026, where the long-term moving average and trendline support are expected to converge. At that level, the stock would be down nearly 40% from the last closing price of $182.
Nvidia stock fundamentals
Meanwhile, with its annual GPU Technology Conference (GTC) set for March 16, Nvidia is positioning itself at the center of the accelerating AI boom, highlighting progress in its product roadmap amid strong demand for AI infrastructure.
Its Vera Rubin platform, unveiled at CES 2026, is drawing attention as the company’s next leap in AI computing. The six-chip architecture aims to reduce inference costs by up to 10x per token compared with current Blackwell systems, targeting the emerging era of agentic AI and large-scale enterprise deployments.
Meanwhile, Blackwell production is scaling alongside key U.S. manufacturing milestones. TSMC’s Arizona facility has begun volume production of Blackwell wafers, while Nvidia is expanding supercomputer assembly in Texas with partners Foxconn and Wistron to meet rising hyperscaler demand for AI infrastructure.
The technology entity is also adjusting its China strategy, reportedly halting production of certain H200 chips for that market to redirect capacity toward next-generation Rubin hardware, aligning with U.S. export restrictions while prioritizing global growth.
Featured image via Shutterstock