
After Palantir Technologies (NYSE: PLTR) stock joined the exclusive society of the S&P 500 index, things seem to be going great for the shares of the big data analytics software company, which have just hit their new all-time high (ATH) price of $36.45, breaking their 2021 record.
Specifically, Palantir stock is currently trading more than 54% above its 200-day simple moving average (SMA), the highest it’s been in over six months, as well as trading above the 20-day and 50-day SMA, according to the data acquired through the crypto and stock market analytics platform TradingView on September 18.
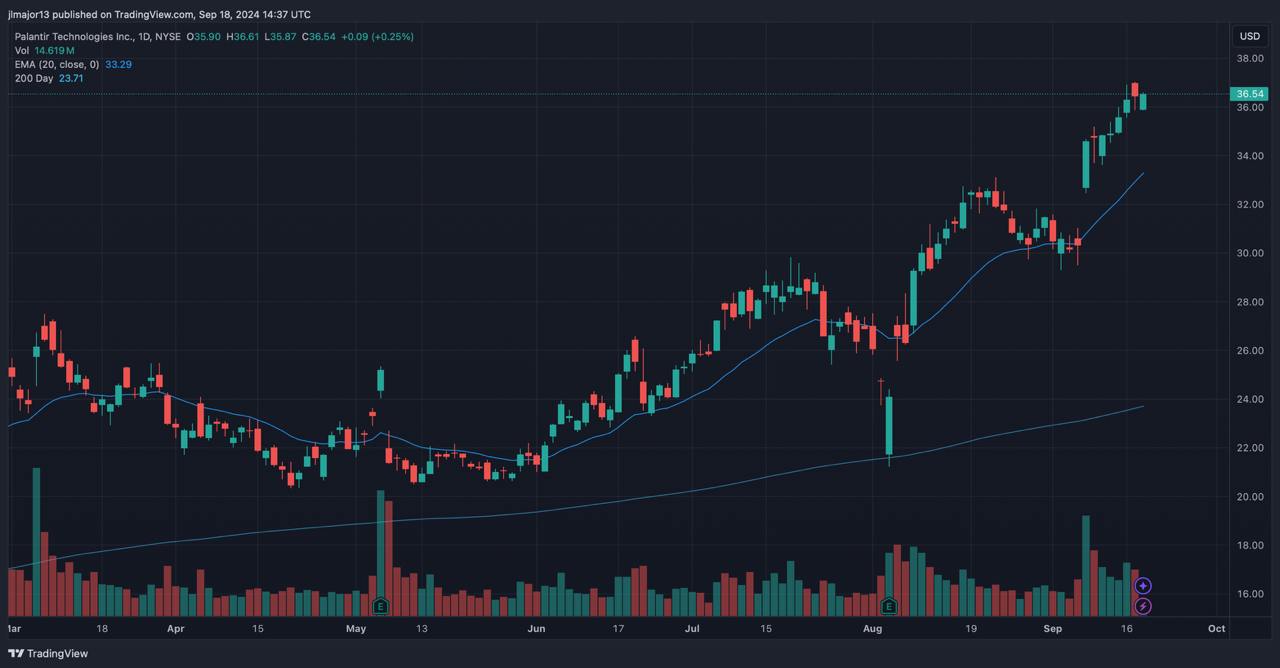
At the same time, this might indicate the possible overextension of the PLTR stock price, which is not an unlikely scenario considering that it might have risen too far too fast and, therefore, the time might be coming for a pullback or correction.
Palantir stock price analysis
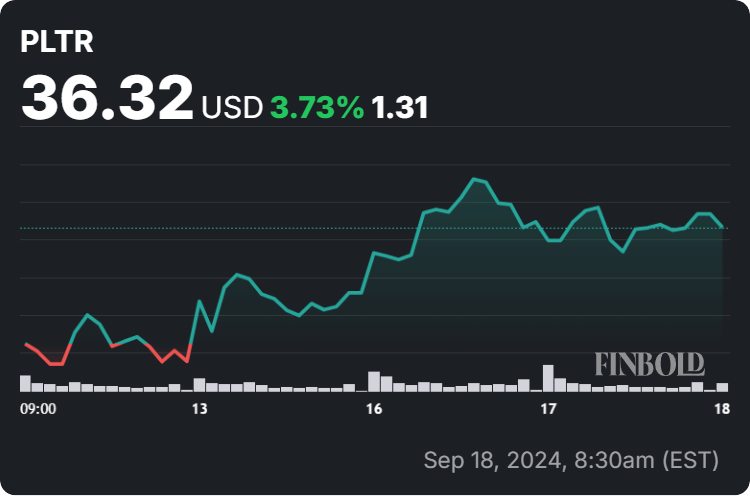
For the time being, the price of PLTR stock stands at $36.32, indicating a decline of 0.44% on the day, an increase of 3.73% across the past week, an 11.90% gain over the month, and an accumulated advance of 119.20% on its year-to-date (YTD) chart.
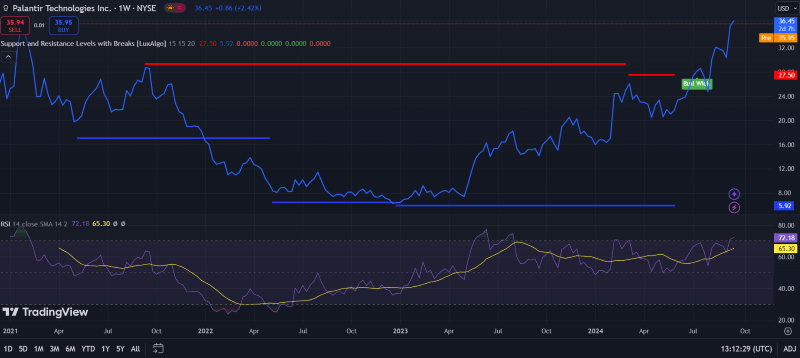
Furthermore, Palantir stock has broken the significant resistance level at $27.50 while the strongest support lies at a very low $5.92, with a more recent support area around $16-$17, according to the most recent chart data retrieved by Finbold on September 18.
On top of that, PLTR stock has been following a substantial upward trend since early 2023, following a prolonged period of sideways movement, while the recent bullish wick suggests strong buying pressure that continues to push the price higher.
What’s next for Palantir stock
Meanwhile, Palantir’s current relative strength index (RSI) value resides at 72.18, which suggests that the stock is, indeed, in the overbought territory (above 70), although its upward trend has confirmed the bullish momentum, with the smoother long-term RSI average.
Elsewhere, despite not dismissing its growth potential in the following year, investor Amrita Roy has said that now might be the time to exit from Palantir stocks, expressing skepticism that the current risk-reward balance makes it a worthwhile investment at this time and writing that:
“Given where Palantir is currently trading, I believe that there is more downside than upside in the short term.”
All things considered, the RSI currently being in the overbought zone for Palantir shares indicates a chance of a short-term pullback, which could precede a further upward move. That said, trends in this sector can easily change, so doing one’s own research and keeping up with any Palantir news, e.g. Palantir earnings date, before investing is critical.
Buy stocks now with eToro – trusted and advanced investment platform
Disclaimer: The content on this site should not be considered investment advice. Investing is speculative. When investing, your capital is at risk.