
Ripple has executed a series of large-scale XRP transfers at a time when the token is struggling to reclaim the $1.5 level.
In this context, on-chain data indicates that the blockchain firm moved nearly 125 million tokens, valued at approximately $178 million.
Blockchain data shows Ripple executed two large XRP transfers within hours: 75 million XRP, valued at about $107 million, moved out of a Ripple-linked wallet, while 50 million XRP, worth around $71.5 million, was sent back to the company from an unknown address.

Further analysis suggests this was a coordinated internal reshuffle rather than an unrelated activity.
Ripple consolidated 50 million XRP into a primary wallet, then redistributed 75 million XRP through intermediary addresses, routing 50 million to two Coinbase-linked wallets and retaining 25 million internally. The use of multiple wallets points to standard liquidity management and exchange compliance practices.
It is worth noting that these transactions differ from Ripple’s routine monthly escrow releases, where one billion XRP is unlocked and most is re-locked.
Instead, they involved existing treasury holdings, pointing to standard internal management rather than scheduled supply changes.
The timing is notable, coming as XRP shows a modest rebound alongside rising institutional interest.

Transfers to Coinbase-linked wallets often signal liquidity provisioning, institutional servicing, or over-the-counter sales, activities Ripple has historically conducted without triggering major sell-offs.
Looking ahead, markets will watch whether the tokens are distributed or held for liquidity. Ripple has a track record of managing such movements without major price disruption, suggesting this may be routine treasury activity rather than a shift in strategy.
XRP price analysis
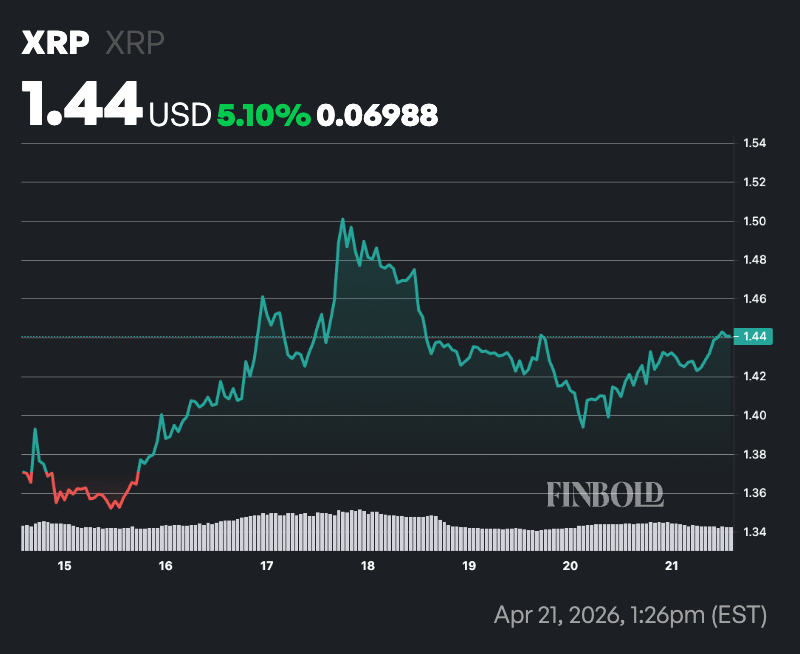
By press time, XRP was trading at $1.44, having gained about 1.2% in the past 24 hours, while on a weekly basis the token is up 5%.
XRP is trading close to its short-term trend but remains under pressure over a broader horizon. The 50-day simple moving average (SMA) sits at about $1.38, slightly below the current price, suggesting mild near-term support and a modest upward bias in the short run.
However, the much higher 200-day SMA at $1.89 indicates the asset is still in a longer-term downtrend or recovery phase, with significant resistance overhead.
Momentum indicators reinforce this neutral stance, with the 14-day RSI at 51.74, almost exactly mid-range, pointing to neither overbought nor oversold conditions.