
The ongoing rally of the S&P 500 index continues to reach new milestones, displaying notable unique trends.
According to an analysis shared by Global Markets Investor in an X post in July, this unique trend impacting the S&P 500’s divergence can be described as “beyond your wildest imagination.”
The analysis noted a remarkable divergence over the past 30 trading sessions. On 15 occasions, the index moved in one direction while the net advance/decline (A/D) ratio moved in the opposite direction.
In simple terms, this means that when the S&P 500 rallied, most stocks within the index declined, and when the S&P 500 fell, most stocks advanced.
Data provided by the platform tracked the number of days in the past 30 sessions when the S&P 500 and the net A/D ratio moved oppositely, dating back to 1928. The recent spike to 15 days is striking, surpassing previous peaks and indicating a significant level of market divergence.
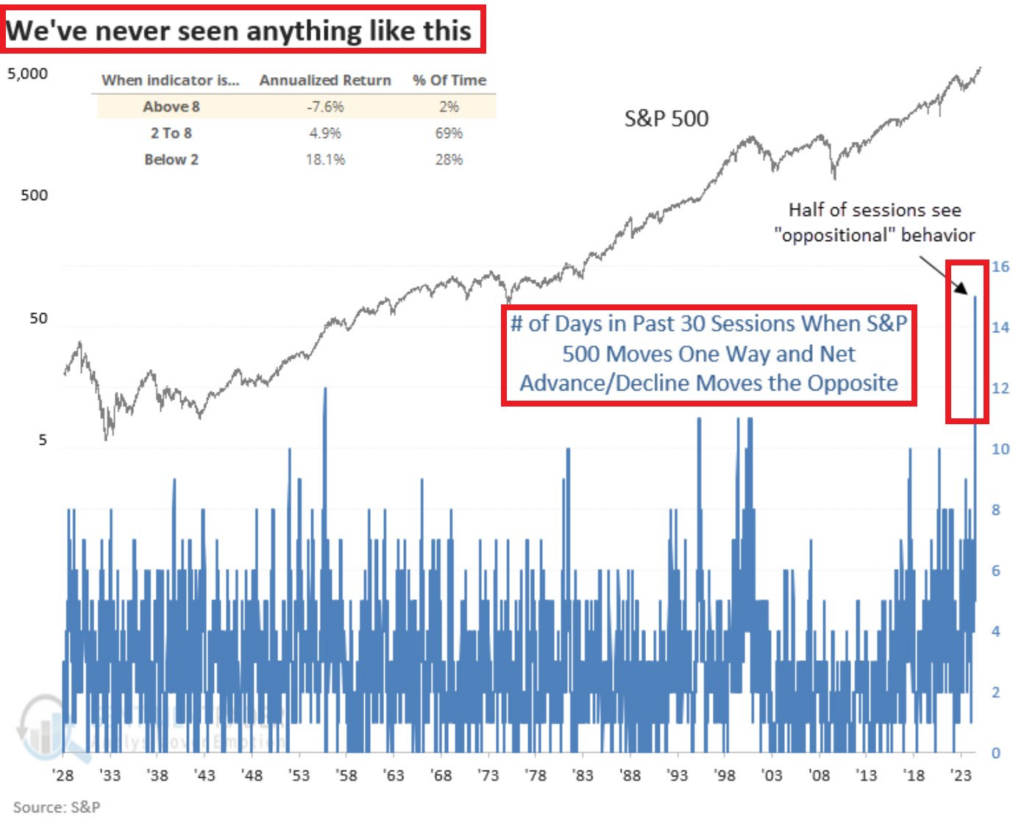
The analysis shared insights into the annualized returns and the percentage of time the market has spent in different divergence states. When the indicator is above 8, the annualized return is -7.6%, occurring 2% of the time. When it is between 2 and 8, the annualized return is 4.9%, occurring 69% of the time. A reading below 2, indicates the annualized return is 18.1%, occurring 28% of the time.
Implication of S&P 500 divergence
This unusual behavior raises questions about the market’s current dynamics and future direction. Historically, such divergences have been rare.
This data suggests caution for investors following the index. The negative annualized return associated with high divergence indicates potential volatility and a lack of broad market support for the S&P 500’s movements.
While the S&P 500 continues to reach new highs, the underlying stock performance paints a different picture, suggesting that the index’s gains may not be as robust as they appear.
Notably, the domination of the index by a select few stocks has occurred rarely, and several analysts believe it could be a potential indicator of an upcoming crash. As reported by Finbold on June 16, only 30% of S&P 500 stocks had outperformed the index year-to-date, a trend resembling the 2000 Dot-com bubble.
It’s worth noting that this dominance has mainly been driven by technology stocks that have bet on artificial intelligence (AI).
In the meantime, the outstanding performance of the S&P 500 is being viewed as a possible sign of an upcoming crash. For instance, economist Henrik Zeberg predicted that the index would likely hit 6,100 points before the worst crash in history.