Skip to content

No results found

To keep going please Log in.

or

By submitting my information, I agree to the Privacy Policy and Terms of Service.

To keep going please Log in.

or

By submitting my information, I agree to the Privacy Policy and Terms of Service.

To keep going please Log in.

or

By submitting my information, I agree to the Privacy Policy and Terms of Service.

To keep going please Log in.

or

By submitting my information, I agree to the Privacy Policy and Terms of Service.

S&P 500 just flashed eerie Dot-com bubble–style pattern

The S&P 500 just flashed eerie Dot-com bubble–style pattern
Paul L.
Stocks

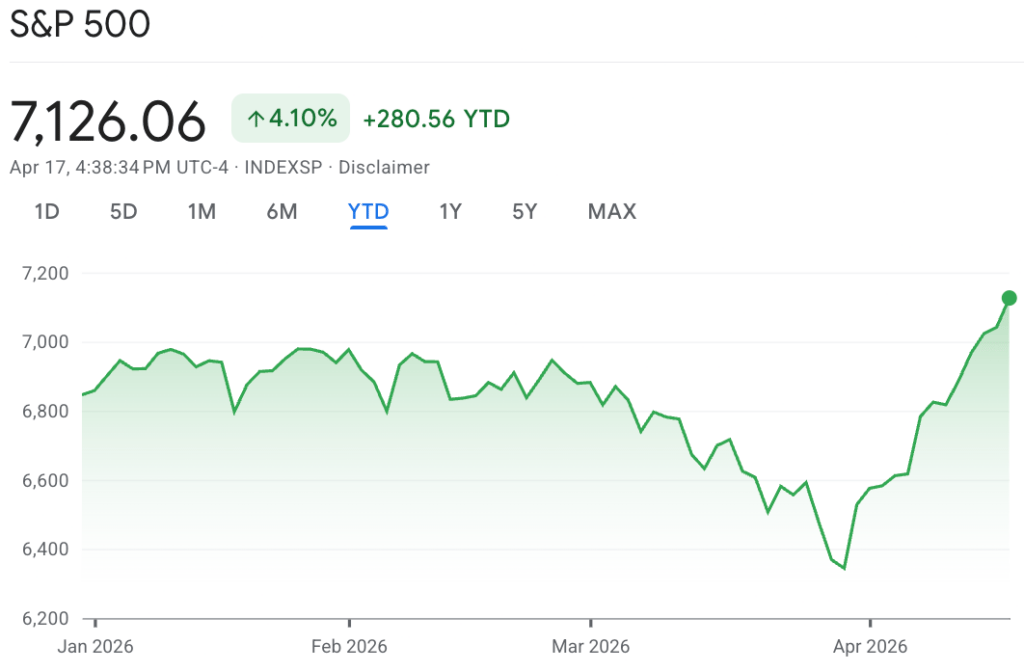
With the S&P 500 pushing past 7,000 to fresh record highs, its chart is drawing striking comparisons to the Dot-com bubble era.

Notably, the index closed Friday at 7,126, up 1.2% on the day and nearly 4% year-to-date. 

S&P 500 YTD price chart. Source: Google Finance

Analysis shows the current trajectory closely resembling the early-2000s market cycle, highlighting parallels between the dot-com boom and today’s AI-driven rally.

The comparison contrasts the 2000 to 2003 peak, when the index rose to about 1,570 before plunging to roughly 830, with a projected path from 2025 to 2029. 

In the current cycle, the S&P 500 is climbing toward around 7,200, reflecting a similarly steep late-stage surge, followed by a potential pullback toward 4,610 in a pattern echoing a multi-year correction.

AI and Dot-com comparisons 

This comes as “dot-com vs. AI bubble” comparisons gain traction in the market, with both periods marked by strong momentum, high valuations, and rising volatility near peaks. 

While the projection is illustrative rather than predictive, it highlights concerns that the market may be entering a late-cycle phase similar to the run-up before the early-2000s downturn.

Notably, the S&P 500 has hovered near record highs, driven by technology and AI stocks, even as concerns linger over sustainability and concentration.

Valuations remain elevated, with the Shiller CAPE ratio around 37 and 40, near historic extremes and close to dot-com-era peaks.

During the late-1990s tech boom, internet hype pushed valuations to unsustainable levels despite weak profits, followed by a nearly 50% decline over about two and a half years. 

Today, technology stocks hold an even larger share of the index, with top names making up roughly one-third, fueled by AI enthusiasm, with companies such as Nvidia (NASDAQ: NVDA) taking the lead.

However, earnings growth is strong, with first-quarter 2026 results pointing to double-digit gains and full-year projections near 17%. Unlike the Dot-com era, today’s market leaders generate substantial profits and cash flow, and forward valuations remain below 2000 extremes.

Meanwhile, high concentration and rich valuations leave little room for disappointment if AI growth slows or economic conditions shift. 

While some warn of weaker long-term returns or a correction, others argue the rally reflects genuine productivity gains.

Best Crypto Exchange for Intermediate Traders and Investors

  • Invest in cryptocurrencies and 3,000+ other assets including stocks and precious metals.

  • 0% commission on stocks - buy in bulk or just a fraction from as little as $10. Other fees apply. For more information, visit etoro.com/trading/fees.

  • Copy top-performing traders in real time, automatically.

  • eToro USA is registered with FINRA for securities trading.

30+ million Users worldwide
Securities trading offered by eToro USA Securities, Inc. (“the BD”), member of FINRA and SIPC. Cryptocurrency offered by eToro USA LLC (“the MSB”) (NMLS: 1769299) and is not FDIC or SIPC insured. Investing involves risk, and content is provided for educational purposes only, does not imply a recommendation, and is not a guarantee of future performance. Finbold.com is not an affiliate and may be compensated if you access certain products or services offered by the MSB and/or the BD
Finbold Career

Join Finbold's newsroom, become a crypto reporter today!

Apply now to join Finbold as a crypto/finance news writer!

Latest posts

Finance Digest

By subscribing you agree with Finbold T&C’s & Privacy Policy

Related posts

Finbold AI Agent

How AI Price Predictions Work

We use cutting-edge AI models to forecast future prices for stocks and crypto.

Home

No results found

IMPORTANT NOTICE

Finbold is a news and information website. This Site may contain sponsored content, advertisements, and third-party materials, for which Finbold expressly disclaims any liability.

RISK WARNING: Cryptocurrencies are high-risk investments and you should not expect to be protected if something goes wrong. Don’t invest unless you’re prepared to lose all the money you invest. (Click here to learn more about cryptocurrency risks.)

By accessing this Site, you acknowledge that you understand these risks and that Finbold bears no responsibility for any losses, damages, or consequences resulting from your use of the Site or reliance on its content. Click here to learn more.