

The S&P 500 could correct towards 6,700 following Democrats’ sweeping victories in the 2026 U.S. midterms, although historical trends point to potential gains over the subsequent six months.
Democrats’ takeover of both chambers of Congress has introduced uncertainty around President Donald Trump’s legislative agenda, particularly taxation, government spending, and technology regulation.
Historically, however, the index has rallied after midterms. Liquid data covering 19 cycles between 1950 and 2022 shows that every November–April period posted gains, averaging 14.8%. Returns ranged from 3.3% in 2014 to 24.8% in 1970, while the 2022 cycle gained 7.7%.
Advertisement
S&P 500 historical returns
At the same time, BlackRock data also shows that the S&P 500 averaged a 14.1% return in the six months following midterms since 1970, compared with 5.7% during equivalent periods in non-midterm years.
However, returns averaged 10.4% when the president’s party lost control of Congress, compared with 16.1% when it gained control or Congress remained divided.
The latest election leaves Trump facing a Democratic-controlled Congress, potentially limiting his legislative agenda.
Markets initially reflected the uncertainty, with U.S. stock futures falling as much as 2% amid concerns about increased scrutiny of AI companies and data center investments.
Futures subsequently recovered into positive territory during Wednesday’s European session, while the 10-year Treasury yield fell three basis points to 4.92% as investors weighed the prospect of slower government spending and delayed tax cuts.
Despite the historical optimism, technical analysis suggests the benchmark index could face further downside before resuming its longer-term upward trajectory.
Advertisement
S&P 500 technical outlook
This was highlighted by TradingShot analysis, which identified a bearish divergence on the S&P 500’s monthly Relative Strength Index (RSI) in a November 3 TradingView post.
While the index has recorded higher highs, its RSI has formed lower highs since January 2026, signalling weakening momentum.
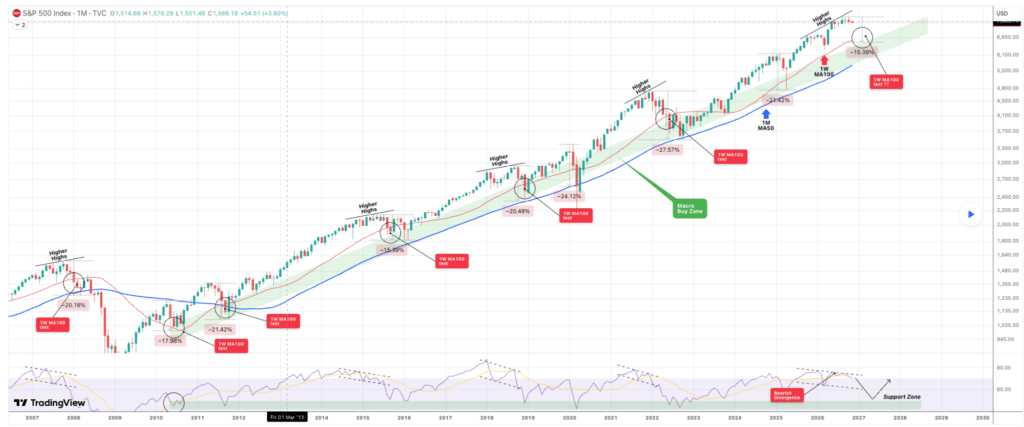
The analyst noted that similar divergences have preceded eight significant corrections since 2007, with the index retreating to its 100-week moving average (MA) in each case and almost always testing its monthly 50-moving average.
Based on these patterns, TradingShot sees a potential decline towards 6,700, representing a 15% correction.
A deeper pullback to 6,400–6,300 is also possible if a stronger external catalyst emerges, potentially extending the downturn into mid-2027.
However, TradingShot expects the long-term outlook to turn bullish again if the monthly RSI reaches its 16-year support zone, regardless of the index’s price.
Featured image via Shutterstock