
While the stock market has seen a short-term correction, valuation levels have hit historic highs, signaling a potentially concerning trend.
The 2025 market peak has surpassed those of 1929, 1966, and 1999, with key valuation metrics, including trailing and forward price-to-earnings (P/E) ratios and the market cap-to-GDP ratio, reaching extreme levels, according to research by Bloomberg’s Simon White, as shared by Barchart on February 23.
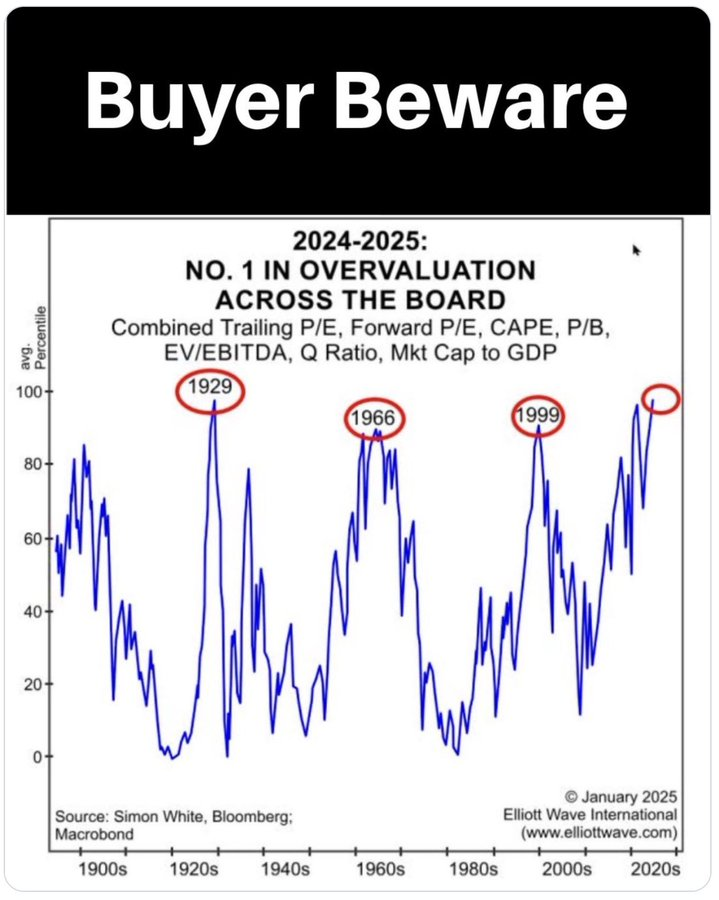
Notably, a review of past market extremes suggests downturns have often followed. For instance, after the 1929 peak, the Great Depression wiped out significant capital.
Picks for you
In 1966, an extended bear market saw the benchmark S&P 500 undergo a multi-year slump. More recently, the infamous Dot-com bubble burst erased the high valuations in 1999.
More concerning is that past valuation peaks and subsequent crashes were marked by massive speculation, high growth expectations, and extreme pricing—conditions that closely resemble today’s market environment.
The current market momentum, which has propelled the S&P 500 to new records, has been largely driven by the technology sector. Companies in the artificial intelligence (AI) space, such as Nvidia (NASDAQ: NVDA) and Palantir (NASDAQ: PLTR), have led the charge.
However, PLTR’s meteoric rise has already prompted caution from some Wall Street analysts, who warn that the stock could crash if it fails to meet growth expectations.
At the same time, Nvidia recently saw a sharp selloff following the emergence of DeepSeek AI, which reportedly used fewer resources than those produced by the chipmaker. This development has raised concerns that major tech giants might cut their AI spending.
S&P 500 bearish divergence warning
Another possible warning sign for a market downturn is also emerging from trends within the S&P 500. Data from Barchart on February 23 indicated that despite the index’s general bullish momentum, the percentage of stocks trading above their 200-day moving average (MA) is declining.

This trend is considered a bearish divergence, signaling that fewer stocks are participating in the rally, a warning that momentum may be weakening beneath the surface. Historically, such divergences have preceded market corrections.
Of particular note, economist Henrik Zeberg predicts the index will rally to new highs before suffering a catastrophic crash that could surpass the 1929 downturn. According to the expert, little can be done to change the course of the predicted crash.
Meanwhile, while long-term market optimism remains, volatility is lingering, partly fueled by President Donald Trump’s announcement of trade tariffs and uncertainty surrounding the Federal Reserve’s next interest rate decision.
Featured image via Shutterstock