
Market interest by bearish investors could be signaling a possible Bitcoin (BTC) price breakout at a time when the leading cryptocurrency continues to be pressured amid a broader market sell-off.
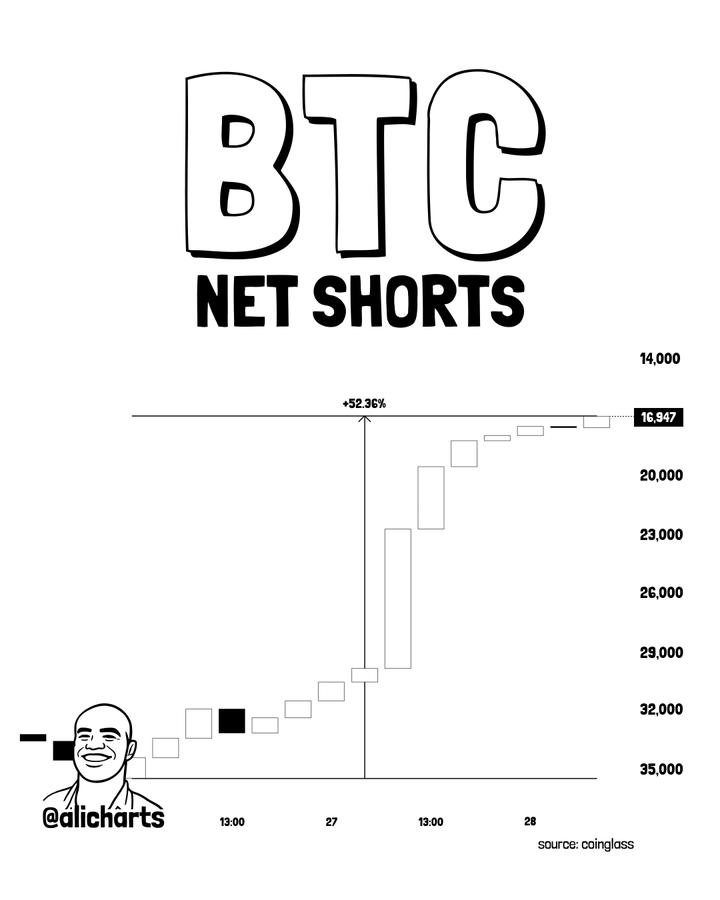
In this context, market data indicates that net short positions on Bitcoin have climbed by more than 52% in just two days, marking one of the most aggressive buildups of downside bets in recent months, according to insights shared by Ali Martinez on March 28.
The outlook shows a steep and sustained rise in net shorts, with positioning accelerating sharply around March 27 before continuing into the following session. This rapid increase suggests that a growing number of market participants are expecting further price declines.
However, such crowded positioning often creates the conditions for the opposite outcome. When too many traders lean heavily in one direction, the market becomes vulnerable to a reversal, particularly if price action begins to move against the consensus view.
In this case, the elevated level of short exposure increases the likelihood of a short squeeze scenario.
If Bitcoin begins to move higher, traders holding short positions may be forced to close to limit losses. This involves buying back the asset, adding upward pressure.
As more positions unwind, the resulting cascade of forced buying can accelerate gains and increase volatility.
This divergence shows that while sentiment has turned increasingly bearish, price has not broken decisively lower, a setup that often precedes a major move.
Although the buildup in shorts does not guarantee a rally, it signals a market at an inflection point, where the imbalance between positioning and price action could set the stage for a breakout depending on the next move.

Bitcoin signals further drop
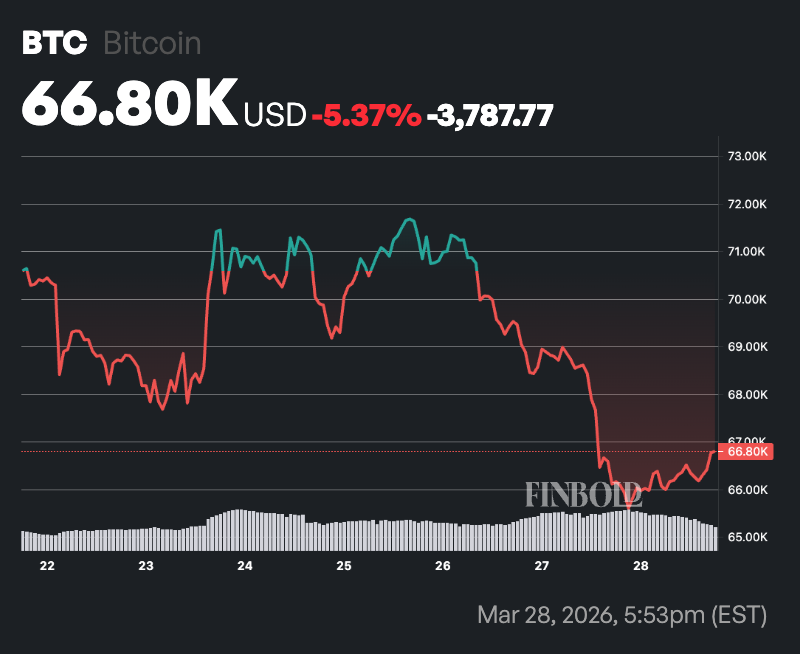
The outlook comes as Bitcoin extended losses below the $70,000 level, with technical indicators hinting at the possibility of further declines.
In this line, analysis by charting platform TrendSpider, shared on March 27, highlighted a striking similarity between Bitcoin’s recent consolidation and a past rising channel formation that ultimately broke to the downside. In the earlier instance, BTC declined more than 34% over roughly two weeks after losing channel support.
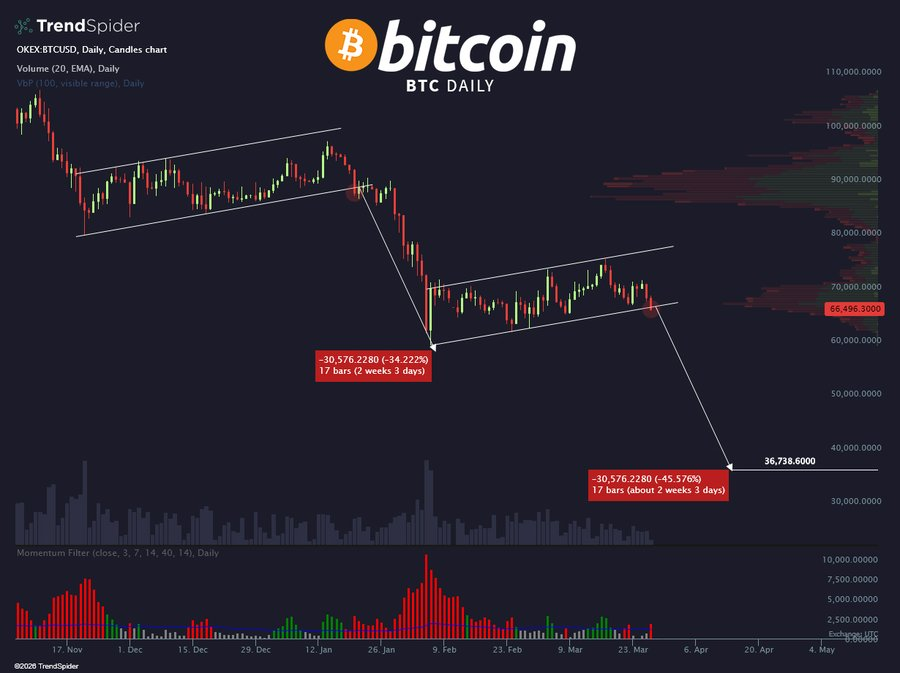
The current pattern is unfolding in a similar way, with price slipping below a short-term ascending channel near $66,000. If history repeats, the setup points to a potential accelerated drop toward the mid-$30,000 range.
Volume profile data also shows relatively thin support below current levels, which could amplify volatility if selling pressure intensifies.
Bitcoin price analysis
At press time, Bitcoin was trading at $66,805, up a modest 1.2% in the past 24 hours, though it remains down more than 5% over the broader timeframe.
As it stands, Bitcoin appears to be in a cautious consolidation phase. A break above $70,000 and $72,000 could signal renewed bullish momentum, while a decisive drop below $65,000 may open the door for further downside pressure.