With gold recently rising partly due to the Federal Reserve’s interest rate cut decision, key technical indicators hint at the possibility of the metal hitting another top in the coming months.
To this end, the precious metal will likely hit a ‘major top’ in the fourth quarter of 2024, driven by significant overbought conditions reflected in its Relative Strength Index (RSI), according to an analysis shared by CyclesFan on September 28.
The 14-month RSI has surged above 80, a rare event that has only occurred three times in the past 20 years. The analyst noted that gold saw a substantial decline of 22 to 34% following the peak each time this happened.
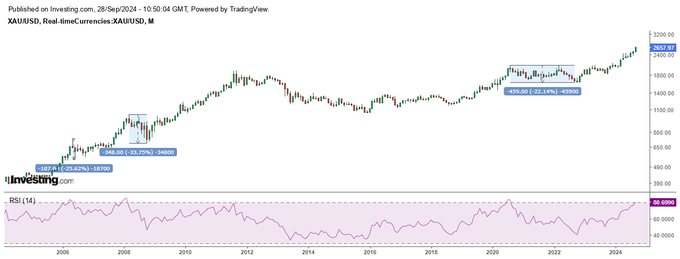
These historical instances were highlighted by gold price peaks in 2006, 2008, and 2020, where the RSI readings reached 84, 85.7, and 83.8, respectively. CyclesFan believes the RSI could continue climbing to similar levels before reaching a top, pointing out that it hasn’t fully exhausted yet. The RSI’s current reading is 80.6, suggesting there may be room for further upside in gold’s price.
Gold’s next major top
Based on historical patterns, the expert predicted that the yellow metal would hit a price of at least $2,815 before the conclusion of Q4, potentially marking the top of the current cycle.
However, if the historical movement continues, a significant correction is expected after gold reaches its anticipated top in the fourth quarter. The analysis draws attention to past declines ranging from 22% to 34%.
It is worth noting that the RSI metric, deployed to gauge momentum, indicates that gold is in an overextended phase, making it increasingly vulnerable to correction. Historically, when the RSI exceeded 80, it signaled that the market had become overheated, eventually leading to a major price reversal.
Mike McGlone, a senior commodity strategist at Bloomberg Intelligence, has previously echoed this possible reversal. He noted that investors should expect a drop to the $2,400 in the interim. However, he believes the metal will likely hit a high of $3,000 long-term.
Besides the RSI indicator, Gold Predictors, through an X post on September 27, observed that the metal has gained momentum after breaking out of a key bullish consolidation zone. In this line, historical chart patterns, including an inverted head and shoulders formation and a triple bottom, suggest that gold is poised for significant gains in the near term.
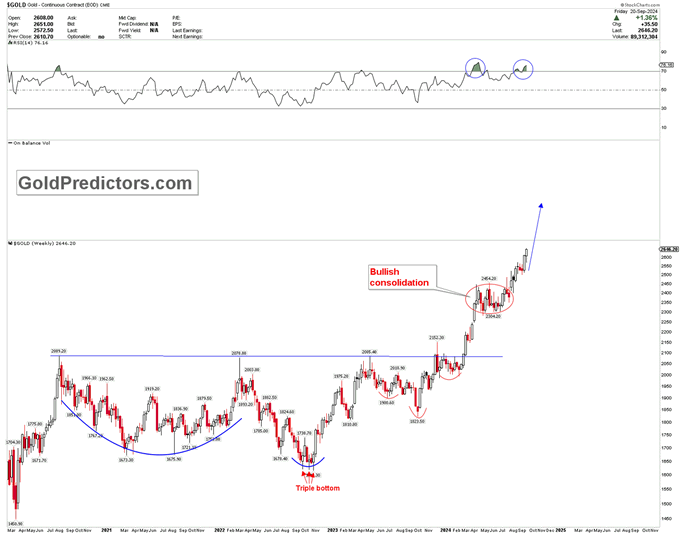
Data shared by the platform indicated that historically, 70% of gold’s price increases during the final stage of a rally occur when the asset is overbought on monthly charts. This trend is backed by 50 years of chart analysis. Gold appears overbought on the weekly and monthly charts, signaling that the precious metal could continue its upward trajectory.
Gold’s fundamentals
Meanwhile, there remains potential for gold to rally further, driven by further monetary easing by the Federal Reserve and escalating geopolitical tensions in the Middle East. In such environments, the metal has been favored by investors due to its ability to serve as a hedge. At the same time, gold has also been elevated amid growing concerns regarding the United States debt crisis.
The prospects of gold rallying are also backed by hedge funds’ investment strategies, with data indicating these institutions are approximately 40% net long on the precious metal, Finbold reported on September 27.
However, not all players view gold’s rally with optimism. Some dissenting voices suggest that the gains could be an anchor to a possible black swan event, such as a potential economic downturn, a debt crisis, or the collapse of risky assets like cryptocurrencies.
In conclusion, although gold is showing potential further growth, investors need to remain cautious, considering key market players and technical indicators are warning of a possible short-term reversal from the $2,600 top.