Skip to content

To keep going please Log in.

or

By submitting my information, I agree to the Privacy Policy and Terms of Service.

To keep going please Log in.

or

By submitting my information, I agree to the Privacy Policy and Terms of Service.

To keep going please Log in.

or

By submitting my information, I agree to the Privacy Policy and Terms of Service.

To keep going please Log in.

or

By submitting my information, I agree to the Privacy Policy and Terms of Service.

This metric set to trigger massive S&P 500 crash, expert warns

This metric set to trigger massive S&P 500 crash, expert warns
Paul L.
Stocks

As the S&P 500 seeks to claim the 7,000 record high, insights from a trading expert suggest the benchmark index could be headed for a correction in the coming months.

Notably, the index has seen volatility in recent months but remains near record levels. As of press time, the S&P 500 was trading at 6,941, down 0.33%.

Regarding the outlook, analysis from TradingShot suggests the S&P 500’s three-year bull cycle, which began after the October 2022 bottom, may be nearing a critical turning point, with liquidity indicators flashing warning signs. 

Since the 2009 housing crisis low, major bear cycles have typically bottomed at or near the 200-week moving average (MA). 

Notably, the 2022 inflation-driven decline followed that pattern, rebounding precisely from that level. 

S&P 500 price analysis chart. Source: TradingView

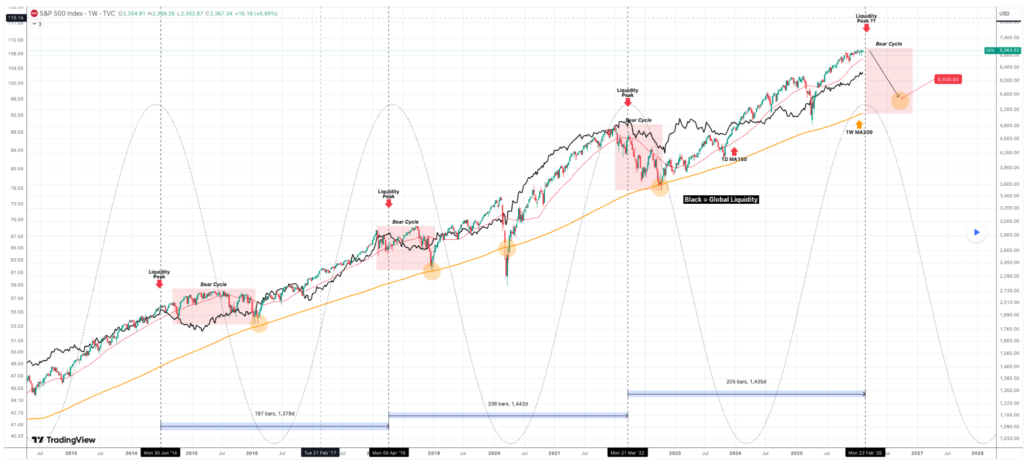
However, since October 2022, the index has not retested the 200-week average, and even last year’s tariff-related correction failed to reach it, a stretch that historically signals overheated, late-stage bull market conditions.

At the same time, the M2 Global Liquidity Index appears to be entering a cyclical peak zone. Liquidity has historically peaked roughly every four years, aligning with major market tops. The next projected peak falls around the week of February 23, 2026, placing the market within that window.

Key S&P 500 levels to watch 

If liquidity is topping, the implication is that the S&P 500 could transition into another systemic bear cycle, with a typical retracement potentially pulling the index back toward the rising 200-week moving average, projected near the 5,500 level.

At the same time, U.S. equities are also flashing a historic valuation signal, with the S&P 500 earnings yield falling to near century lows based on Shiller CAPE data. 

In this line, according to Barchart, the yield is hovering around 3%, a level only breached during the late 1990s dot-com bubble.

As the inverse of the P/E ratio, the earnings yield shows how much investors earn per dollar invested. Lower yields signal higher valuations, indicating investors are accepting thinner returns for exposure to U.S. stocks.

Historically, yields surged above 15% during crises such as the Great Depression and rose again in the 1970s and early 1980s, while strong growth periods pushed them lower. 

Although not a guaranteed warning of a downturn, current levels suggest valuations are stretched, leaving little room for disappointment in earnings or the broader economy.

Featured image via Shutterstock


Best Crypto Exchange for Intermediate Traders and Investors

  • Invest in cryptocurrencies and 3,000+ other assets including stocks and precious metals.

  • 0% commission on stocks - buy in bulk or just a fraction from as little as $10. Other fees apply. For more information, visit etoro.com/trading/fees.

  • Copy top-performing traders in real time, automatically.

  • eToro USA is registered with FINRA for securities trading.

30+ million Users worldwide
Securities trading offered by eToro USA Securities, Inc. (“the BD”), member of FINRA and SIPC. Cryptocurrency offered by eToro USA LLC (“the MSB”) (NMLS: 1769299) and is not FDIC or SIPC insured. Investing involves risk, and content is provided for educational purposes only, does not imply a recommendation, and is not a guarantee of future performance. Finbold.com is not an affiliate and may be compensated if you access certain products or services offered by the MSB and/or the BD
Finbold Career

Join Finbold's newsroom, become a crypto reporter today!

Apply now to join Finbold as a crypto/finance news writer!

Latest posts

Finance Digest

By subscribing you agree with Finbold T&C’s & Privacy Policy

Related posts

Stocks

Finbold AI Agent

How AI Price Predictions Work

We use cutting-edge AI models to forecast future prices for stocks and crypto.

Home

IMPORTANT NOTICE

Finbold is a news and information website. This Site may contain sponsored content, advertisements, and third-party materials, for which Finbold expressly disclaims any liability.

RISK WARNING: Cryptocurrencies are high-risk investments and you should not expect to be protected if something goes wrong. Don’t invest unless you’re prepared to lose all the money you invest. (Click here to learn more about cryptocurrency risks.)

By accessing this Site, you acknowledge that you understand these risks and that Finbold bears no responsibility for any losses, damages, or consequences resulting from your use of the Site or reliance on its content. Click here to learn more.