With Nvidia (NASDAQ: NVDA) stock resuming its bullish momentum, the equity’s technical indicators suggest that a price target of $150 might be on the horizon.
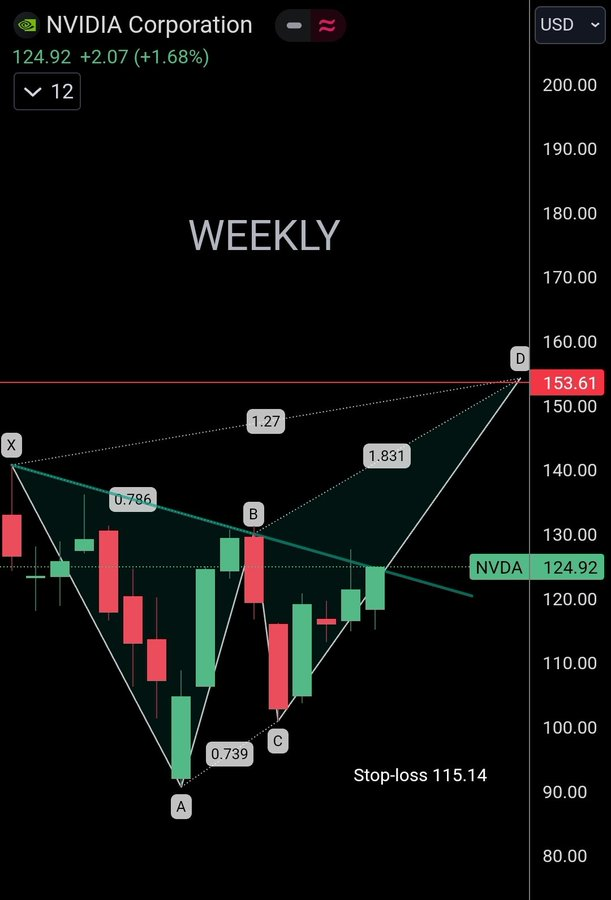
Precisely, the stock’s weekly chart is forming a butterfly pattern, a harmonic pattern used to anticipate trend reversals. In this case, the price movement points to a potential target between $150 and $154, per an analysis shared by Harmonic Patterns in an X post on October 7.
This pattern consists of four legs, each corresponding to Fibonacci levels that indicate possible price shifts. The first leg marks a decline from Point X to Point A, forming the first wing. The subsequent A to B leg shows a retracement bounce, typically around the 78.6% Fibonacci level. The B to C leg then creates a secondary dip, aligning with the 73.9% level.
The crucial C to D leg signals the projected reversal point. Notably, the D point, calculated by extending the A to B move by 1.27 or 1.618 times, targets $153.61, indicating Nvidia may experience a bullish move before encountering resistance.
Chief Strategist Scott Redler also shared this bullish technical outlook, who stated in an X post on October 7 that NVDA shares have the potential for further upside if they hold above the $121.90 support level. Currently, key resistance levels stand at $127.67 and $136.15.
If the stock sustains gains above $125.02, it could trigger further bullish sentiment, with a possible target of $140 in sight.

NVDA stock key fundamentals
As things stand, if Nvidia stock manages to reach $150, it could open the door to a potential target of $200, which will be aided by other underlying fundamentals, especially the company’s involvement in the artificial intelligence (AI) space.
To this end, the semiconductor giant’s CEO, Jensen Huang, unveiled the company’s AI plan. As reported by Finbold, the tech firm now aims to make annual advancements similar to the leap from Hopper to Blackwell microchip infrastructure. If realized, this plan could increase the capacity of companies utilizing AI infrastructure.
Although the company faces competition from rivals such as Advanced Micro Devices (NASDAQ: AMD), Nvidia’s upcoming Blackwell graphics processing units (GPUs) are expected to boost investor confidence. The company has admitted to recording intense demand for the product, which has caused tension among customers.
Based on Blackwell’s potential, Phil Panaro, a former senior advisor at the Boston Consulting Group, noted that revenue generated from the chip could push Nvidia’s share price to $800 by 2030, with revenue reaching $600 billion by the same year.
NVDA share price analysis
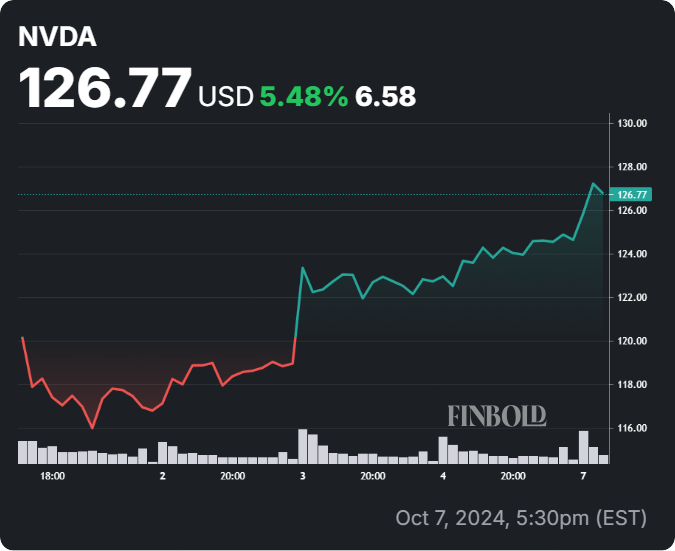
By the time of reporting, Nvidia had established its price above the $125 mark, gaining by about 1.6% in the last 24 hours. It is currently trading at $126. On the weekly chart, NVDA is up over 5%.
Overall, Nvidia is demonstrating a clear, bullish technical uptrend. The stock is trading above its 50-day simple moving average (SMA), indicating short-term upward momentum. Additionally, NVDA is above its 200-day SMA, which is at $96.13, reinforcing long-term bullish sentiment.