
Bitcoin (BTC) may have confirmed a decisive shift into bearish territory after slipping beneath a key long-term technical threshold closely followed by seasoned market analysts.
The 730-day simple moving average (SMA), a two-year trend gauge that has historically marked transitions into Bitcoin bear markets, now sits at roughly $81,250, according to insights shared by cryptocurrency analyst Ali Martinez in an X post on November 22.
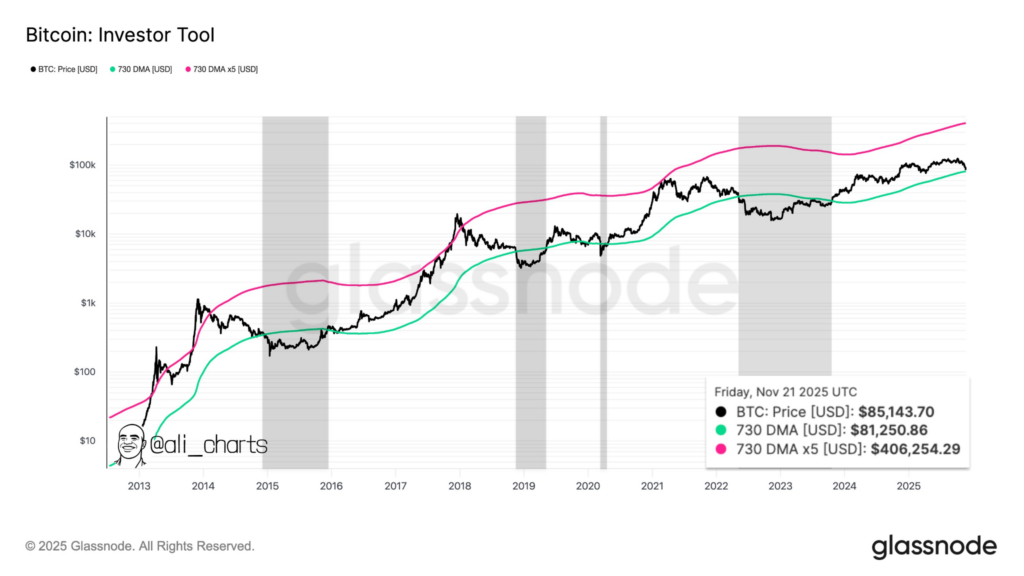
According to the analysis, Bitcoin’s recent price action has pushed it below this level, a move that in past cycles has preceded extended periods of downward or sideways market performance.
The indicator, often referred to as an “investor tool,” overlays Bitcoin’s multiyear price trajectory with the 730-day SMA and its five-times multiple. Previous cycles show that losing the lower band has typically aligned with major cyclical peaks already being set and market sentiment gradually turning risk-off.
The latest reading reinforces that pattern, where with Bitcoin trading around the mid-$80,000 range, the breakdown signals weakening momentum after a long-running uptrend.
Notably, the two-year SMA functions as a structural line of support during bull phases, and falling beneath it has historically flagged macro exhaustion. While not a guarantee of deeper losses, the move suggests the market may now be entering a prolonged cool-down phase, especially as broader risk sentiment remains fragile and liquidity trends soften.
Bitcoin key price levels to watch
This outlook comes as Bitcoin attempted to reclaim the $85,000 level after a week of heavy selling. Analysis by Ted Pillows in an X post on November 22 suggested that failure to recover the $85,000 resistance zone could send Bitcoin back toward $80,000.

According to the analyst, the next critical zone to watch for Bitcoin is the $85,000–$86,000 area following a sharp multi-week sell-off. The region, which previously acted as a demand zone, is now being retested from below as the market attempts to stabilize after a steep drop from above $100,000.
His outlook outlines multiple potential rebound paths if Bitcoin can close back above this band, with upside targets clustering around $89,000, $92,000, and $95,000, levels that served as support throughout the year before breaking down in November.
If buyers fail to defend the $85,000–$86,000 region, the technical picture turns considerably weaker. The next visible support sits just above $80,000, and losing that level could trigger a fast move into the $78,000–$79,000 range highlighted in green.
As of press time, Bitcoin was trading at $84,239, down approximately 0.3% in the past 24 hours. On the weekly timeframe, the asset has declined by over 11%.
Featured image via Shutterstock