
A trading analyst has outlined a long-term timeline for Bitcoin’s (BTC) next major price milestone, arguing that the cryptocurrency is unlikely to reach $145,000 until the current market cycle has fully reset.
According to TradingShot, recent developments on high-timeframe technical indicators suggest Bitcoin has entered the early stages of a broader bear cycle, as outlined in a TradingView analysis on January 30.
The assessment is grounded in quarterly chart signals, where Bitcoin has recently moved past a Relative Vigor Index (RVGI) bearish cross. On higher timeframes, the RVGI is viewed as a cycle-defining indicator rather than a short-term momentum signal.
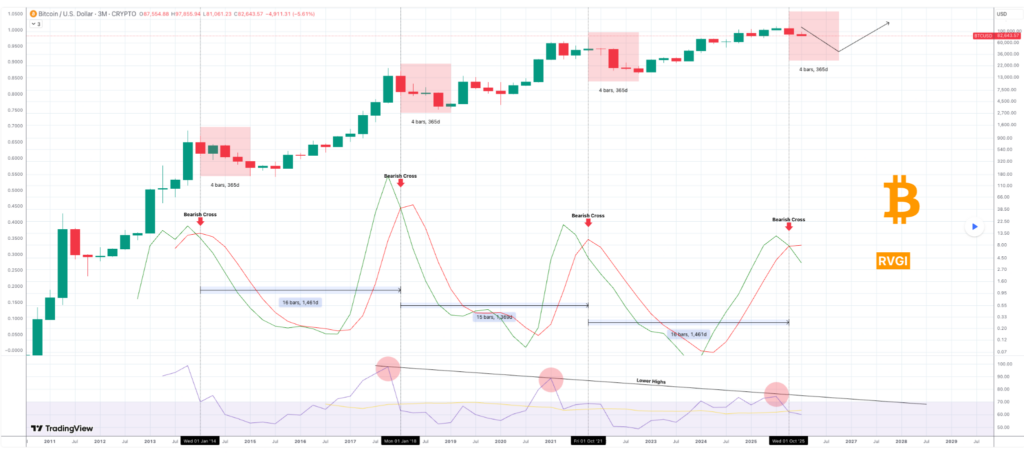
TradingShot noted that in past Bitcoin cycles, similar three-month bearish crosses consistently emerged in the early stages of bear markets, not near cycle bottoms.
Historical data also shows a clear rhythm, with RVGI bearish crosses occurring roughly every 15 to 16 quarters, in line with Bitcoin’s four-year cycle.
In each case, a market bottom followed about four quarters later, pointing to roughly a year of downside or consolidation. Based on this pattern, the current cycle suggests a potential bottom around October 2026.
Momentum indicators support this view, with the quarterly RSI peaking one quarter before the RVGI bearish cross and being rejected at a long-term declining trendline that has capped momentum for nearly seven years.
This behavior echoes prior cycle transitions that preceded extended corrections, suggesting macro bullish momentum has already been exhausted despite the possibility of short-term rallies.
Bitcoin price levels to watch
From a price standpoint, TradingShot expects any gains in the coming quarters to remain corrective.

Historically, Bitcoin has not made new all-time highs between a quarterly RVGI bearish cross and the eventual cycle bottom, instead spending months stabilizing and rebuilding momentum.
Within this context, the $145,000 target is assigned to the next bull cycle. If a bottom forms in late 2026, a prolonged accumulation period into mid-2027 would likely follow before a sustained breakout.
Accordingly, TradingShot’s outlook sees late 2027 or 2028 as the most realistic window for Bitcoin to reach $145,000, once quarterly momentum turns decisively higher again.
Bitcoin price analysis
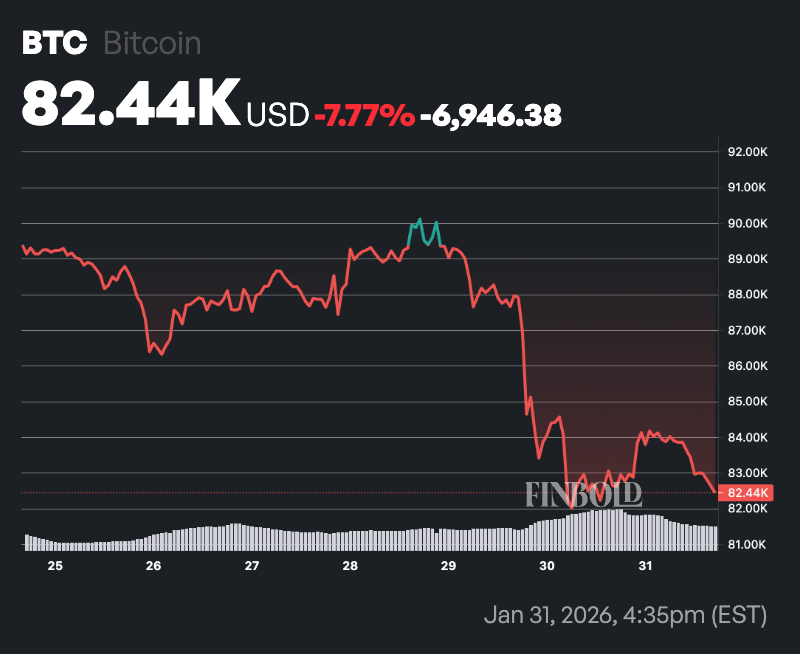
By press time, Bitcoin was trading at $82,444, having declined by a modest 0.2% over the past 24 hours, while on the weekly chart the leading cryptocurrency was down nearly 8%.
Overall, Bitcoin continues to show signs of bearishness, trading well below its key trend indicators. The 50-day SMA is near $89,828, while the 200-day SMA stands much higher at about $104,184.
With price below both averages and the short-term SMA beneath the long-term one, momentum remains negative, pointing to an ongoing corrective or consolidation phase rather than a renewed uptrend.
However, downside pressure is easing with the 14-day RSI at 33.4, which sits just above oversold levels, signaling weak momentum but also suggesting that selling intensity is moderating.
Featured image via Shutterstock