
Nvidia (NASDAQ: NVDA) could face a sharp correction to $130 by late December 2026 if a long-term bearish cycle unfolds as it did during previous market peaks, according to a technical analysis.
The prediction represents a potential 40% decline from Nvidia’s press-time price of $217.
The bearish NVDA stock forecast comes despite Nvidia delivering another blockbuster earnings report that reinforced its dominance in artificial intelligence infrastructure.
In an analysis published by TradingShot in a TradingView post on August 27, the analyst argued that the stock is displaying technical conditions similar to those seen before major corrections in 2018 and 2022, raising the possibility of a new bearish leg that could send shares as much as 38% lower from current levels.
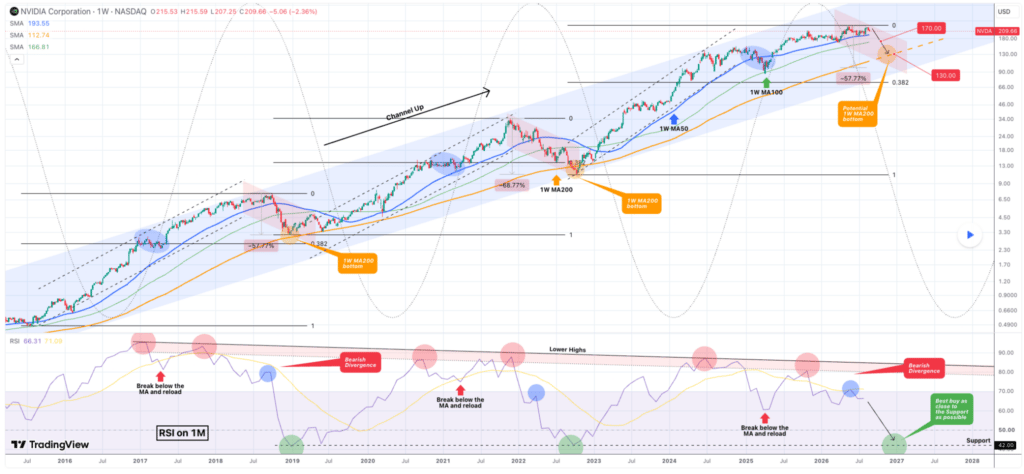
According to the outlook, Nvidia has been trading within an 11-year ascending channel dating back to July 2015. Within that structure, the stock has historically moved through cyclical bullish and bearish legs that have produced major tops and bottoms.
TradingShot believes Nvidia’s current cycle likely peaked at its May 14, 2026, all-time high. Since then, price action has largely moved sideways despite strong fundamental developments and continued enthusiasm surrounding artificial intelligence.
The analyst highlighted a recurring sine-wave cycle that previously identified major turning points in 2018 and 2022.
Based on that pattern, the current cycle is expected to transition into a long-term correction that could bottom near the end of 2026.
Furthermore, the analyst noted an initial downside target of around $170, which aligns with Nvidia’s weekly 100-week moving average and several key support levels from 2025 and 2026.
Nvidia stock’s momentum
However, a weekly close below that level could open the door to a deeper decline toward the weekly 200-week moving average (MA). Based on its projected trajectory, that support level is expected to sit near $130 by late December 2026.
A key part of the bearish outlook is Nvidia’s monthly Relative Strength Index (RSI), which has shown a bearish divergence since June 2024 as momentum failed to confirm new price highs. Similar setups preceded the stock’s major corrections in 2018 and 2022.
The analysis shows the RSI testing a long-term descending resistance trendline near the overbought 70 level.
Previous rejections from this zone led to sharp declines that eventually pushed the indicator toward its 42 support level. In both prior cycles, Nvidia bottomed near its 200-week moving average, supporting the significance of the $130 target.
Indeed, the outlook comes in the wake of Nvidia reporting another blockbuster earnings. In this case, the semiconductor giant on August 26 reported fiscal second-quarter 2027 revenue of $96.2 billion, up 106% year-over-year, while data center revenue climbed to $89 billion.
The company also guided for third-quarter revenue of about $108 billion, topping Wall Street expectations and highlighting continued strength in AI demand.
Featured image via Shutterstock