
The first U.S. spot XRP exchange-traded fund (ETF) has fallen more than 20% from its post-launch peak, despite strong early institutional demand.
In this context, the Canary XRP ETF, which trades on Nasdaq under the ticker XRPC, closed the last session at $20.26, leaving it down about 23.9% from its launch.
Notably, the ETF rallied into the mid-$26 range shortly after launch before reversing lower. At the same time, XRPC has fallen about 8.5% in the latest session and is down more than 10% over the past five trading days.
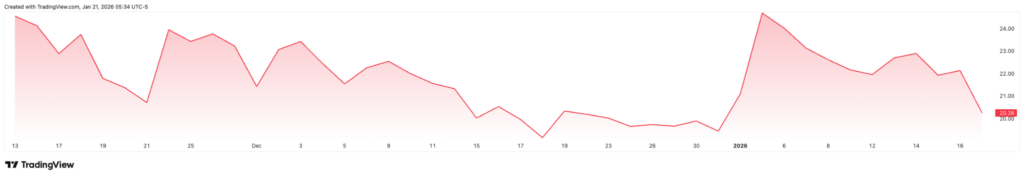
While the ETF remains marginally positive on a one-month basis, up roughly 1.5%, the fund has recorded repeated failures to sustain rebounds. Year-to-date performance is essentially flat, masking the sharp decline from the launch high.
The weakness stands in contrast to the ETF’s strong debut. The Canary fund made history as the first U.S. spot XRP ETF, offering regulated exposure to XRP without direct token ownership, and drew heavy early trading volumes amid pent-up demand following years of regulatory uncertainty.
Institutional flows initially reinforced that optimism, with XRP spot ETFs absorbing about $483 million in December 2025 even as Bitcoin and Ethereum ETFs saw outflows, pushing total assets to roughly $1.3 billion within weeks.
However, chart performance highlights a growing gap between inflows and price resilience.
After peaking shortly after launch, XRPC slipped into a volatile but persistent decline, suggesting ETF demand has been insufficient to offset weakness in the underlying XRP market and shifting risk appetite. Recent sessions also point to investor rebalancing after an extended period of inflows.
Indeed, the ETF’s performance comes at a time when XRP is showing weakness in line with broader cryptocurrency market sentiment, with the asset dropping below the $2 support zone.
XRP price analysis
By press time, XRP was trading at $1.91, down about 0.8% over the past 24 hours. On a weekly basis, the asset is lower by roughly 10%.
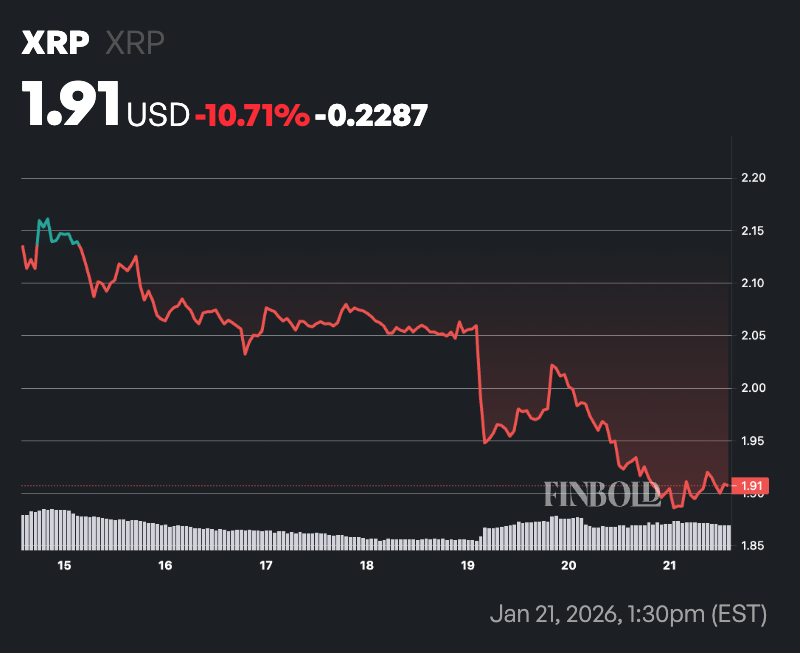
From a technical perspective, XRP continues to trade below key moving averages. The 50-day simple moving average (SMA) stands near $2.01, while the 200-day SMA is significantly higher at around $2.52, pointing to a firmly bearish medium- to long-term trend.
On the other hand, momentum indicators offer little relief, with the 14-day RSI at about 42, a neutral reading that suggests selling pressure has eased but has not yet reversed.
Featured image via Shutterstock